Brazil - Chemical Wood Pulp - Market Analysis, Forecast, Size, Trends and Insights
Get instant access to more than 2 million reports, dashboards, and datasets on the IndexBox Platform.
View PricingBrazil's Export of Chemical Wood Pulp Plummets to $7.2B in 2023
Brazil Chemical Wood Pulp Exports
In 2023, shipments abroad of chemical wood pulp decreased by -4.7% to 18M tons for the first time since 2012, thus ending a ten-year rising trend. Overall, total exports indicated a strong expansion from 2013 to 2023: its volume increased at an average annual rate of +6.8% over the last decade. The trend pattern, however, indicated some noticeable fluctuations being recorded throughout the analyzed period. Based on 2023 figures, exports increased by +92.8% against 2013 indices. The pace of growth appeared the most rapid in 2022 when exports increased by 22% against the previous year. As a result, the exports reached the peak of 19M tons, and then reduced modestly in the following year.
In value terms, chemical wood pulp exports reduced to $7.2B (IndexBox estimates) in 2023. In general, total exports indicated a pronounced increase from 2013 to 2023: its value increased at an average annual rate of +4.0% over the last decade. The trend pattern, however, indicated some noticeable fluctuations being recorded throughout the analyzed period. Based on 2023 figures, exports increased by +25.6% against 2020 indices. The pace of growth appeared the most rapid in 2018 when exports increased by 33% against the previous year. As a result, the exports attained the peak of $7.9B. From 2019 to 2023, the growth of the exports failed to regain momentum.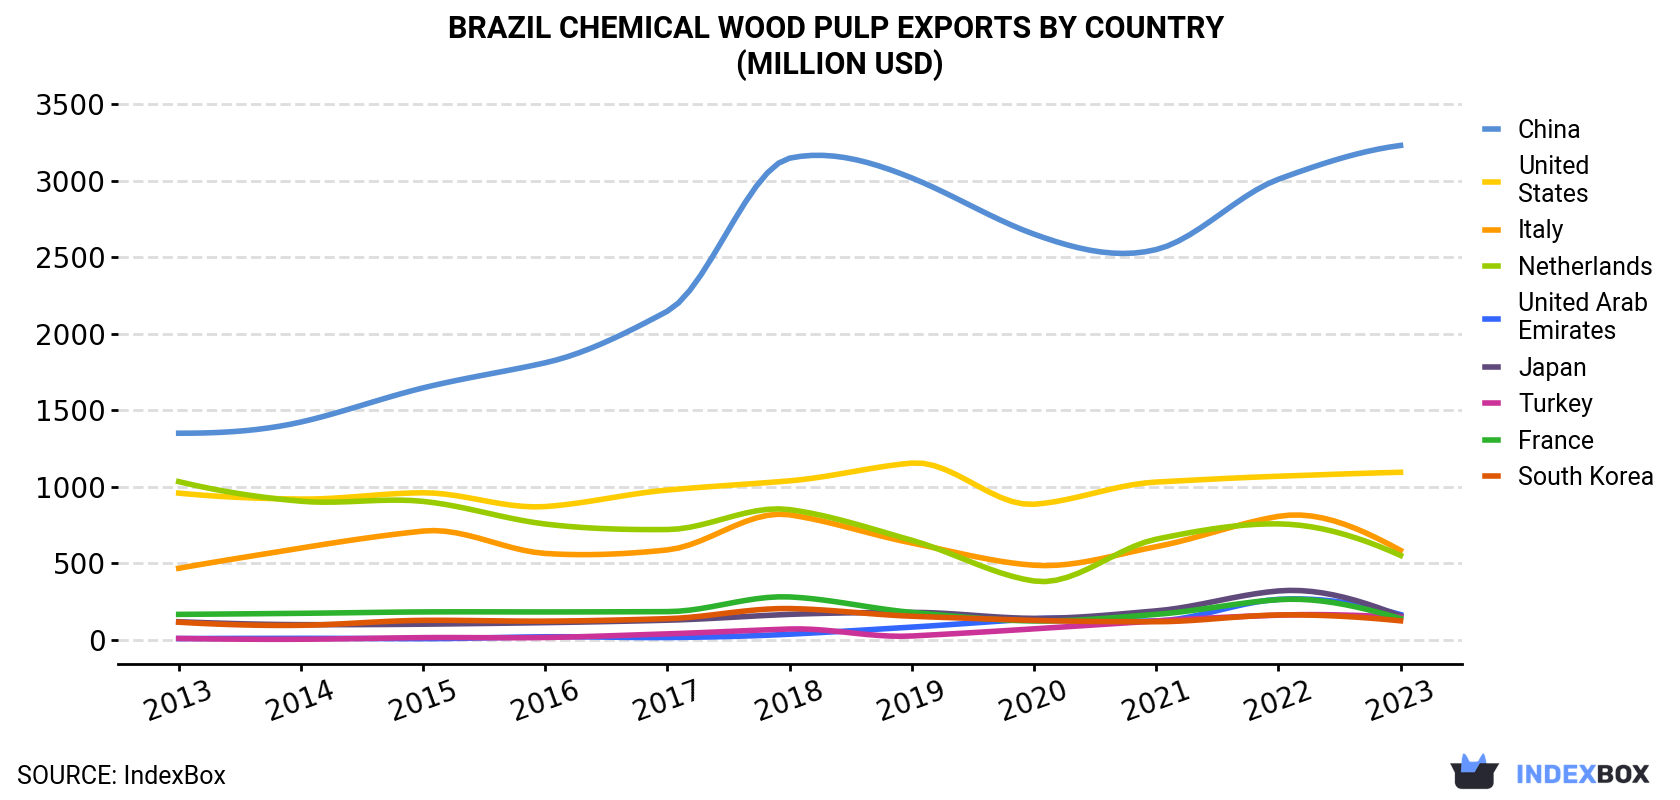
| COUNTRY | Export Value of Chemical Wood Pulp in Brazil (million USD) | ||||||||||
|---|---|---|---|---|---|---|---|---|---|---|---|
| 2013 | 2014 | 2015 | 2016 | 2017 | 2018 | 2019 | 2020 | 2021 | 2022 | 2023 | |
| China | 1,350 | 1,423 | 1,646 | 1,810 | 2,147 | 3,146 | 3,017 | 2,650 | 2,549 | 3,008 | 3,229 |
| United States | 959 | 920 | 961 | 871 | 979 | 1,039 | 1,155 | 886 | 1,031 | 1,069 | 1,095 |
| Italy | 468 | 600 | 711 | 565 | 588 | 817 | 633 | 488 | 609 | 807 | 585 |
| Netherlands | 1,034 | 906 | 905 | 757 | 721 | 851 | 651 | 385 | 658 | 758 | 552 |
| United Arab Emirates | 9.0 | 10.7 | 8.3 | 20.8 | 16.0 | 37.6 | 83.9 | 138 | 124 | 265 | 166 |
| Japan | 119 | 100 | 103 | 113 | 129 | 167 | 180 | 141 | 190 | 320 | 157 |
| Turkey | 10.0 | 4.7 | 15.2 | 16.1 | 39.8 | 71.5 | 25.9 | 72.6 | 124 | 162 | 148 |
| France | 167 | 174 | 183 | 183 | 185 | 281 | 180 | 124 | 167 | 263 | 140 |
| South Korea | 116 | 95.7 | 128 | 123 | 139 | 205 | 155 | 128 | 119 | 163 | 125 |
| Others | 625 | 709 | 709 | 802 | 1,024 | 1,327 | 1,088 | 698 | 858 | 1,111 | 979 |
| Total | 4,857 | 4,942 | 5,369 | 5,261 | 5,969 | 7,943 | 7,168 | 5,711 | 6,430 | 7,926 | 7,176 |
Exports by Country
China (8.9M tons) was the main destination for chemical wood pulp exports from Brazil, accounting for a 49% share of total exports. Moreover, chemical wood pulp exports to China exceeded the volume sent to the second major destination, the United States (2.6M tons), threefold. Italy (1.4M tons) ranked third in terms of total exports with a 7.8% share.
From 2013 to 2023, the average annual growth rate of volume to China amounted to +12.7%. Exports to the other major destinations recorded the following average annual rates of exports growth: the United States (+3.4% per year) and Italy (+4.6% per year).
In value terms, China ($3.2B) remains the key foreign market for chemical wood pulp exports from Brazil, comprising 45% of total exports. The second position in the ranking was taken by the United States ($1.1B), with a 15% share of total exports. It was followed by Italy, with an 8.2% share.
From 2013 to 2023, the average annual rate of growth in terms of value to China totaled +9.1%. Exports to the other major destinations recorded the following average annual rates of exports growth: the United States (+1.3% per year) and Italy (+2.3% per year).
Exports by Type
Bleached sulphate pulp (13M tons) was the largest type of chemical wood pulp exported from Brazil, accounting for a 99% share of total exports. It was followed by bleached sulphite pulp (74K tons), with a 0.6% share of total exports. Unbleached sulphate pulp (945 tons) ranked third in terms of total exports with less than 0.1% share.
From 2013 to 2017, the average annual rate of growth in terms of the volume of bleached sulphate pulp exports totaled +8.8%. With regard to the other exported products, the following average annual rates of growth were recorded: bleached sulphite pulp (+13.4% per year) and unbleached sulphate pulp (-45.7% per year).
In value terms, bleached sulphate pulp ($5.9B) remains the largest type of chemical wood pulp exported from Brazil, comprising 99% of total exports. The second position in the ranking was held by bleached sulphite pulp ($44M), with a 0.7% share of total exports. It was followed by unbleached sulphate pulp, with less than 0.1% share.
From 2013 to 2017, the average annual growth rate of the value of bleached sulphate pulp exports totaled +5.3%. With regard to the other exported products, the following average annual rates of growth were recorded: bleached sulphite pulp (+9.8% per year) and unbleached sulphate pulp (-41.2% per year).
Export Prices by Country
In 2023, the chemical wood pulp price amounted to $393 per ton (FOB, Brazil), waning by -5% against the previous year. Overall, the export price showed a noticeable decrease. The pace of growth appeared the most rapid in 2018 when the average export price increased by 20% against the previous year. As a result, the export price attained the peak level of $541 per ton. From 2019 to 2023, the average export prices remained at a somewhat lower figure.
There were significant differences in the average prices for the major external markets. In 2023, amid the top suppliers, the country with the highest price was Japan ($553 per ton), while the average price for exports to Germany ($352 per ton) was amongst the lowest.
From 2013 to 2023, the most notable rate of growth in terms of prices was recorded for supplies to Japan (+0.7%), while the prices for the other major destinations experienced a decline.
This report provides an in-depth analysis of the chemical wood pulp market in Brazil. Within it, you will discover the latest data on market trends and opportunities by country, consumption, production and price developments, as well as the global trade (imports and exports). The forecast exhibits the market prospects through 2030.
Product coverage:
- FCL 1660 - Chemical wood pulp, sulphite, unbleached
- FCL 1661 - Chemical wood pulp, sulphite, bleached
- FCL 1662 - Chemical wood pulp, sulphate, unbleached
- FCL 1663 - Chemical wood pulp, sulphate, bleached
Country coverage:
- Brazil
Data coverage:
- Market volume and value
- Per Capita consumption
- Forecast of the market dynamics in the medium term
- Trade (exports and imports) in Brazil
- Export and import prices
- Market trends, drivers and restraints
- Key market players and their profiles
Reasons to buy this report:
- Take advantage of the latest data
- Find deeper insights into current market developments
- Discover vital success factors affecting the market
This report is designed for manufacturers, distributors, importers, and wholesalers, as well as for investors, consultants and advisors.
In this report, you can find information that helps you to make informed decisions on the following issues:
- How to diversify your business and benefit from new market opportunities
- How to load your idle production capacity
- How to boost your sales on overseas markets
- How to increase your profit margins
- How to make your supply chain more sustainable
- How to reduce your production and supply chain costs
- How to outsource production to other countries
- How to prepare your business for global expansion
While doing this research, we combine the accumulated expertise of our analysts and the capabilities of artificial intelligence. The AI-based platform, developed by our data scientists, constitutes the key working tool for business analysts, empowering them to discover deep insights and ideas from the marketing data.
-
1. INTRODUCTION
Making Data-Driven Decisions to Grow Your Business
- REPORT DESCRIPTION
- RESEARCH METHODOLOGY AND AI PLATFORM
- DATA-DRIVEN DECISIONS FOR YOUR BUSINESS
- GLOSSARY AND SPECIFIC TERMS
-
2. EXECUTIVE SUMMARY
A Quick Overview of Market Performance
- KEY FINDINGS
- MARKET TRENDS This Chapter is Available Only for the Professional Edition PRO
-
3. MARKET OVERVIEW
Understanding the Current State of The Market and Its Prospects
- MARKET SIZE
- MARKET STRUCTURE
- TRADE BALANCE
- PER CAPITA CONSUMPTION
- MARKET FORECAST TO 2030
-
4. MOST PROMISING PRODUCT
Finding New Products to Diversify Your Business
This Chapter is Available Only for the Professional Edition PRO- TOP PRODUCTS TO DIVERSIFY YOUR BUSINESS
- BEST-SELLING PRODUCTS
- MOST CONSUMED PRODUCT
- MOST TRADED PRODUCT
- MOST PROFITABLE PRODUCT FOR EXPORT
-
5. MOST PROMISING SUPPLYING COUNTRIES
Choosing the Best Countries to Establish Your Sustainable Supply Chain
This Chapter is Available Only for the Professional Edition PRO- TOP COUNTRIES TO SOURCE YOUR PRODUCT
- TOP PRODUCING COUNTRIES
- TOP EXPORTING COUNTRIES
- LOW-COST EXPORTING COUNTRIES
-
6. MOST PROMISING OVERSEAS MARKETS
Choosing the Best Countries to Boost Your Exports
This Chapter is Available Only for the Professional Edition PRO- TOP OVERSEAS MARKETS FOR EXPORTING YOUR PRODUCT
- TOP CONSUMING MARKETS
- UNSATURATED MARKETS
- TOP IMPORTING MARKETS
- MOST PROFITABLE MARKETS
7. PRODUCTION
The Latest Trends and Insights into The Industry
- PRODUCTION VOLUME AND VALUE
8. IMPORTS
The Largest Import Supplying Countries
- IMPORTS FROM 2012–2023
- IMPORTS BY COUNTRY
- IMPORT PRICES BY COUNTRY
9. EXPORTS
The Largest Destinations for Exports
- EXPORTS FROM 2012–2023
- EXPORTS BY COUNTRY
- EXPORT PRICES BY COUNTRY
-
10. PROFILES OF MAJOR PRODUCERS
The Largest Producers on The Market and Their Profiles
This Chapter is Available Only for the Professional Edition PRO -
LIST OF TABLES
- Key Findings In 2023
- Market Volume, In Physical Terms, 2012–2023
- Market Value, 2012–2023
- Per Capita Consumption In 2012-2023
- Imports, In Physical Terms, By Country, 2012–2023
- Imports, In Value Terms, By Country, 2012–2023
- Import Prices, By Country Of Origin, 2012–2023
- Exports, In Physical Terms, By Country, 2012–2023
- Exports, In Value Terms, By Country, 2012–2023
- Export Prices, By Country Of Destination, 2012–2023
-
LIST OF FIGURES
- Market Volume, In Physical Terms, 2012–2023
- Market Value, 2012–2023
- Market Structure – Domestic Supply vs. Imports, In Physical Terms, 2012-2023
- Market Structure – Domestic Supply vs. Imports, In Value Terms, 2012-2023
- Trade Balance, In Physical Terms, 2012-2023
- Trade Balance, In Value Terms, 2012-2023
- Per Capita Consumption, 2012-2023
- Market Volume Forecast to 2030
- Market Value Forecast to 2030
- Products: Market Size And Growth, By Type
- Products: Average Per Capita Consumption, By Type
- Products: Exports And Growth, By Type
- Products: Export Prices And Growth, By Type
- Production Volume And Growth
- Exports And Growth
- Export Prices And Growth
- Market Size And Growth
- Per Capita Consumption
- Imports And Growth
- Import Prices
- Production, In Physical Terms, 2012–2023
- Production, In Value Terms, 2012–2023
- Imports, In Physical Terms, 2012–2023
- Imports, In Value Terms, 2012–2023
- Imports, In Physical Terms, By Country, 2023
- Imports, In Physical Terms, By Country, 2012–2023
- Imports, In Value Terms, By Country, 2012–2023
- Import Prices, By Country Of Origin, 2012–2023
- Exports, In Physical Terms, 2012–2023
- Exports, In Value Terms, 2012–2023
- Exports, In Physical Terms, By Country, 2023
- Exports, In Physical Terms, By Country, 2012–2023
- Exports, In Value Terms, By Country, 2012–2023
- Export Prices, By Country Of Destination, 2012–2023


