
Italy - Grinding Or Polishing Machines For Working Stone, Ceramics And Concrete - Market Analysis, Forecast, Size, Trends And Insights
Get instant access to more than 2 million reports, dashboards, and datasets on the IndexBox Platform.
View PricingItaly Sees a 15% Surge in Exports of Stone Polishing Machines to Reach $282M in 2023
Italy Stone Polishing Machine Exports
In 2023, overseas shipments of grinding or polishing machines for working stone, ceramics and concrete increased by 6.3% to 30K units, rising for the fifth consecutive year after two years of decline. Over the period under review, exports enjoyed a prominent expansion. The pace of growth was the most pronounced in 2021 when exports increased by 58% against the previous year. Over the period under review, the exports attained the maximum in 2023 and are likely to continue growth in years to come.
In value terms, stone polishing machine exports amounted to $282M (IndexBox estimates) in 2023. In general, exports, however, saw a slight curtailment. The growth pace was the most rapid in 2021 with an increase of 29%. The exports peaked at $311M in 2018; however, from 2019 to 2023, the exports stood at a somewhat lower figure.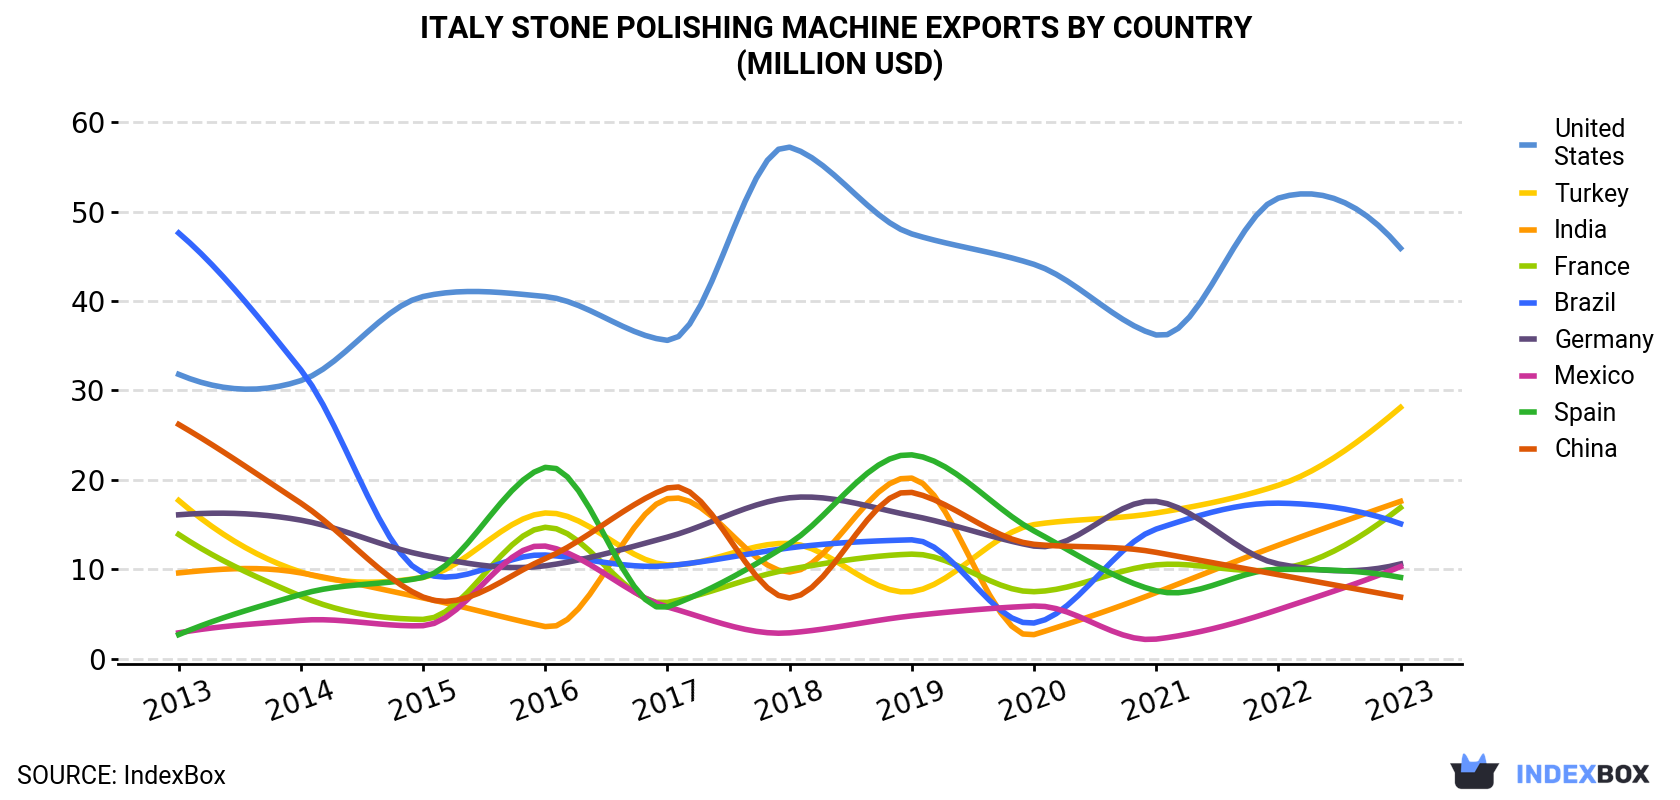
| COUNTRY | Export Value of Stone Polishing Machine in Italy (million USD) | ||||||||||
|---|---|---|---|---|---|---|---|---|---|---|---|
| 2013 | 2014 | 2015 | 2016 | 2017 | 2018 | 2019 | 2020 | 2021 | 2022 | 2023 | |
| United States | 31.8 | 31.1 | 40.5 | 40.5 | 35.6 | 57.2 | 47.5 | 44.1 | 36.2 | 51.5 | 45.9 |
| Turkey | 17.7 | 9.7 | 9.1 | 16.3 | 10.5 | 12.9 | 7.5 | 15.0 | 16.3 | 19.4 | 28.1 |
| India | 9.6 | 9.6 | 6.8 | 3.6 | 17.9 | 9.7 | 20.2 | 2.7 | 7.4 | 12.7 | 17.6 |
| France | 13.9 | 7.0 | 4.4 | 14.7 | 6.3 | 10.0 | 11.7 | 7.5 | 10.5 | 10.0 | 16.9 |
| Brazil | 47.6 | 32.3 | 9.6 | 11.6 | 10.4 | 12.4 | 13.3 | 4.0 | 14.5 | 17.4 | 15.1 |
| Germany | 16.1 | 15.5 | 11.6 | 10.4 | 13.6 | 18.0 | 16.0 | 12.6 | 17.6 | 10.6 | 10.6 |
| Mexico | 2.9 | 4.3 | 3.7 | 12.6 | 5.8 | 2.9 | 4.8 | 5.9 | 2.2 | 5.5 | 10.3 |
| Spain | 2.7 | 7.2 | 9.1 | 21.4 | 5.8 | 12.9 | 22.8 | 14.3 | 7.6 | 10.0 | 9.1 |
| China | 26.2 | 17.4 | 6.9 | 11.2 | 19.1 | 6.8 | 18.6 | 12.8 | 11.9 | 9.4 | 6.9 |
| Others | 142 | 145 | 137 | 115 | 123 | 168 | 139 | 83.2 | 136 | 99.6 | 122 |
| Total | 311 | 279 | 239 | 258 | 248 | 311 | 302 | 202 | 260 | 246 | 282 |
Exports by Country
the United States (3.8K units), Turkey (3.4K units) and Brazil (2.1K units) were the main destinations of stone polishing machine exports from Italy, with a combined 31% share of total exports. France, India, Mexico, Spain, Germany and China lagged somewhat behind, together comprising a further 23%.
From 2013 to 2023, the biggest increases were recorded for India (with a CAGR of +27.1%), while shipments for the other leaders experienced more modest paces of growth.
In value terms, the United States ($46M), Turkey ($28M) and India ($18M) were the largest markets for stone polishing machine exported from Italy worldwide, together accounting for 32% of total exports. France, Brazil, Germany, Mexico, Spain and China lagged somewhat behind, together comprising a further 24%.
Among the main countries of destination, Mexico, with a CAGR of +13.6%, recorded the highest growth rate of the value of exports, over the period under review, while shipments for the other leaders experienced more modest paces of growth.
Export Prices by Country
In 2023, the stone polishing machine price amounted to $9,381 per unit (FOB, Italy), with an increase of 17% against the previous year. In general, the export price, however, saw a deep downturn. The most prominent rate of growth was recorded in 2017 an increase of 151%. The export price peaked at $39,961 per unit in 2018; however, from 2019 to 2023, the export prices failed to regain momentum.
Prices varied noticeably by country of destination: amid the top suppliers, the country with the highest price was Germany ($12,622 per unit), while the average price for exports to Morocco ($4,866 per unit) was amongst the lowest.
From 2013 to 2023, the most notable rate of growth in terms of prices was recorded for supplies to the United States (-1.6%), while the prices for the other major destinations experienced a decline.
This report provides an in-depth analysis of the stone polishing machine market in Italy. Within it, you will discover the latest data on market trends and opportunities by country, consumption, production and price developments, as well as the global trade (imports and exports). The forecast exhibits the market prospects through 2030.
Product coverage:
- Prodcom 28491150 - Grinding or polishing machines for working stone, ceramics, c oncrete, asbestos-cement or like mineral materials or for cold working glass
Country coverage:
- Italy
Data coverage:
- Market volume and value
- Per Capita consumption
- Forecast of the market dynamics in the medium term
- Trade (exports and imports) in Italy
- Export and import prices
- Market trends, drivers and restraints
- Key market players and their profiles
Reasons to buy this report:
- Take advantage of the latest data
- Find deeper insights into current market developments
- Discover vital success factors affecting the market
This report is designed for manufacturers, distributors, importers, and wholesalers, as well as for investors, consultants and advisors.
In this report, you can find information that helps you to make informed decisions on the following issues:
- How to diversify your business and benefit from new market opportunities
- How to load your idle production capacity
- How to boost your sales on overseas markets
- How to increase your profit margins
- How to make your supply chain more sustainable
- How to reduce your production and supply chain costs
- How to outsource production to other countries
- How to prepare your business for global expansion
While doing this research, we combine the accumulated expertise of our analysts and the capabilities of artificial intelligence. The AI-based platform, developed by our data scientists, constitutes the key working tool for business analysts, empowering them to discover deep insights and ideas from the marketing data.
-
1. INTRODUCTION
Making Data-Driven Decisions to Grow Your Business
- REPORT DESCRIPTION
- RESEARCH METHODOLOGY AND AI PLATFORM
- DATA-DRIVEN DECISIONS FOR YOUR BUSINESS
- GLOSSARY AND SPECIFIC TERMS
-
2. EXECUTIVE SUMMARY
A Quick Overview of Market Performance
- KEY FINDINGS
- MARKET TRENDS This Chapter is Available Only for the Professional Edition PRO
-
3. MARKET OVERVIEW
Understanding the Current State of The Market and Its Prospects
- MARKET SIZE
- MARKET STRUCTURE
- TRADE BALANCE
- PER CAPITA CONSUMPTION
- MARKET FORECAST TO 2030
-
4. MOST PROMISING PRODUCT
Finding New Products to Diversify Your Business
This Chapter is Available Only for the Professional Edition PRO- TOP PRODUCTS TO DIVERSIFY YOUR BUSINESS
- BEST-SELLING PRODUCTS
- MOST CONSUMED PRODUCT
- MOST TRADED PRODUCT
- MOST PROFITABLE PRODUCT FOR EXPORT
-
5. MOST PROMISING SUPPLYING COUNTRIES
Choosing the Best Countries to Establish Your Sustainable Supply Chain
This Chapter is Available Only for the Professional Edition PRO- TOP COUNTRIES TO SOURCE YOUR PRODUCT
- TOP PRODUCING COUNTRIES
- TOP EXPORTING COUNTRIES
- LOW-COST EXPORTING COUNTRIES
-
6. MOST PROMISING OVERSEAS MARKETS
Choosing the Best Countries to Boost Your Exports
This Chapter is Available Only for the Professional Edition PRO- TOP OVERSEAS MARKETS FOR EXPORTING YOUR PRODUCT
- TOP CONSUMING MARKETS
- UNSATURATED MARKETS
- TOP IMPORTING MARKETS
- MOST PROFITABLE MARKETS
7. PRODUCTION
The Latest Trends and Insights into The Industry
- PRODUCTION VOLUME AND VALUE
8. IMPORTS
The Largest Import Supplying Countries
- IMPORTS FROM 2012–2023
- IMPORTS BY COUNTRY
- IMPORT PRICES BY COUNTRY
9. EXPORTS
The Largest Destinations for Exports
- EXPORTS FROM 2012–2023
- EXPORTS BY COUNTRY
- EXPORT PRICES BY COUNTRY
-
10. PROFILES OF MAJOR PRODUCERS
The Largest Producers on The Market and Their Profiles
This Chapter is Available Only for the Professional Edition PRO -
LIST OF TABLES
- Key Findings In 2023
- Market Volume, In Physical Terms, 2012–2023
- Market Value, 2012–2023
- Per Capita Consumption In 2012-2023
- Imports, In Physical Terms, By Country, 2012–2023
- Imports, In Value Terms, By Country, 2012–2023
- Import Prices, By Country Of Origin, 2012–2023
- Exports, In Physical Terms, By Country, 2012–2023
- Exports, In Value Terms, By Country, 2012–2023
- Export Prices, By Country Of Destination, 2012–2023
-
LIST OF FIGURES
- Market Volume, In Physical Terms, 2012–2023
- Market Value, 2012–2023
- Market Structure – Domestic Supply vs. Imports, In Physical Terms, 2012-2023
- Market Structure – Domestic Supply vs. Imports, In Value Terms, 2012-2023
- Trade Balance, In Physical Terms, 2012-2023
- Trade Balance, In Value Terms, 2012-2023
- Per Capita Consumption, 2012-2023
- Market Volume Forecast to 2030
- Market Value Forecast to 2030
- Products: Market Size And Growth, By Type
- Products: Average Per Capita Consumption, By Type
- Products: Exports And Growth, By Type
- Products: Export Prices And Growth, By Type
- Production Volume And Growth
- Exports And Growth
- Export Prices And Growth
- Market Size And Growth
- Per Capita Consumption
- Imports And Growth
- Import Prices
- Production, In Physical Terms, 2012–2023
- Production, In Value Terms, 2012–2023
- Imports, In Physical Terms, 2012–2023
- Imports, In Value Terms, 2012–2023
- Imports, In Physical Terms, By Country, 2023
- Imports, In Physical Terms, By Country, 2012–2023
- Imports, In Value Terms, By Country, 2012–2023
- Import Prices, By Country Of Origin, 2012–2023
- Exports, In Physical Terms, 2012–2023
- Exports, In Value Terms, 2012–2023
- Exports, In Physical Terms, By Country, 2023
- Exports, In Physical Terms, By Country, 2012–2023
- Exports, In Value Terms, By Country, 2012–2023
- Export Prices, By Country Of Destination, 2012–2023


