
Netherlands - Instruments For Dental Sciences - Market Analysis, Forecast, Size, Trends And Insights
Get instant access to more than 2 million reports, dashboards, and datasets on the IndexBox Platform.
View PricingExport of Dental Instruments in the Netherlands Decreases by 3% to $582M in 2023
Netherlands Dental Instruments Exports
In 2023, after five years of growth, there was significant decline in overseas shipments of instruments for dental sciences, when their volume decreased by -22.4% to 546M units. In general, exports, however, enjoyed a prominent increase. The most prominent rate of growth was recorded in 2019 with an increase of 128%. Over the period under review, the exports attained the maximum at 704M units in 2022, and then reduced markedly in the following year.
In value terms, dental instruments exports fell modestly to $582M (IndexBox estimates) in 2023. Over the period under review, exports, however, saw a resilient increase. The pace of growth was the most pronounced in 2019 with an increase of 59%. The exports peaked at $602M in 2022, and then reduced slightly in the following year.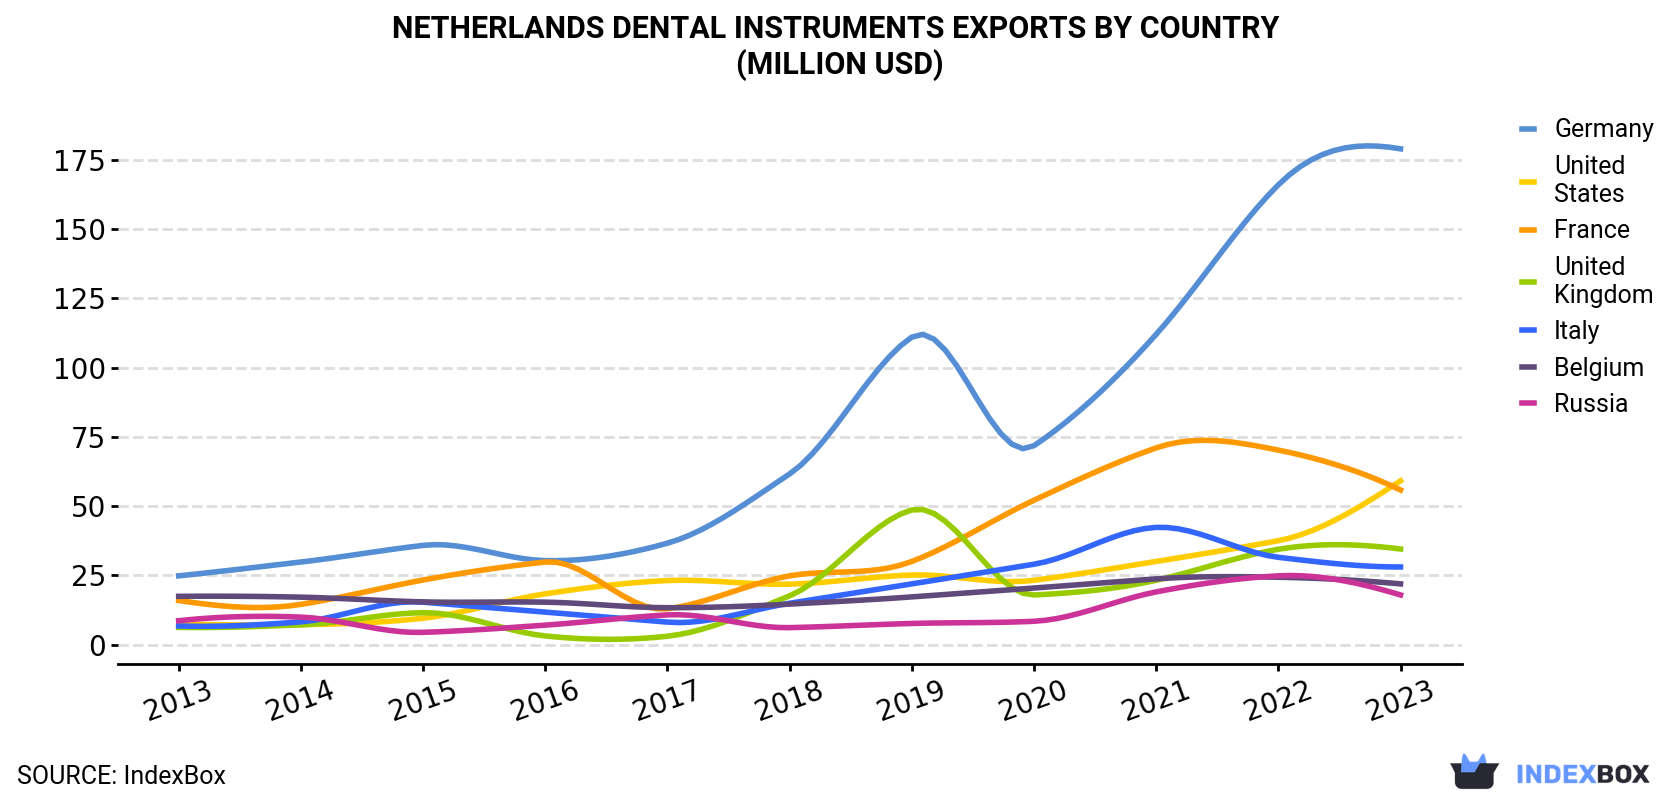
| COUNTRY | Export Value of Dental Instruments in Netherlands (million USD) | ||||||||||
|---|---|---|---|---|---|---|---|---|---|---|---|
| 2013 | 2014 | 2015 | 2016 | 2017 | 2018 | 2019 | 2020 | 2021 | 2022 | 2023 | |
| Germany | 24.8 | 29.8 | 35.8 | 30.3 | 36.6 | 61.6 | 111 | 71.8 | 112 | 166 | 179 |
| United States | 7.5 | 7.2 | 9.5 | 18.3 | 23.1 | 21.8 | 25.1 | 23.2 | 30.0 | 37.5 | 59.1 |
| France | 15.9 | 14.5 | 23.3 | 29.8 | 12.9 | 24.8 | 30.0 | 52.1 | 71.0 | 70.2 | 55.8 |
| United Kingdom | 6.2 | 7.1 | 11.5 | 3.1 | 3.0 | 17.6 | 48.6 | 17.9 | 23.2 | 34.4 | 34.5 |
| Italy | 6.7 | 8.2 | 15.3 | 11.7 | 8.1 | 14.9 | 21.9 | 29.0 | 42.3 | 31.5 | 28.0 |
| Belgium | 17.4 | 17.1 | 15.4 | 15.3 | 13.3 | 14.6 | 17.2 | 20.4 | 23.7 | 24.3 | 21.9 |
| Russia | 8.6 | 9.9 | 4.4 | 7.0 | 10.7 | 6.1 | 7.6 | 8.4 | 19.0 | 24.8 | 17.9 |
| Others | 53.0 | 64.6 | 78.7 | 64.1 | 73.2 | 88.2 | 137 | 135 | 198 | 214 | 185 |
| Total | 140 | 158 | 194 | 180 | 181 | 250 | 398 | 358 | 520 | 602 | 582 |
Exports by Country
Germany (239M units) was the main destination for dental instruments exports from the Netherlands, accounting for a 44% share of total exports. Moreover, dental instruments exports to Germany exceeded the volume sent to the second major destination, France (76M units), threefold. Italy (37M units) ranked third in terms of total exports with a 6.9% share.
From 2013 to 2023, the average annual rate of growth in terms of volume to Germany amounted to +11.3%. Exports to the other major destinations recorded the following average annual rates of exports growth: France (+11.8% per year) and Italy (+14.4% per year).
In value terms, Germany ($179M) remains the key foreign market for instruments for dental sciences exports from the Netherlands, comprising 31% of total exports. The second position in the ranking was taken by the United States ($59M), with a 10% share of total exports. It was followed by France, with a 9.6% share.
From 2013 to 2023, the average annual growth rate of value to Germany stood at +21.9%. Exports to the other major destinations recorded the following average annual rates of exports growth: the United States (+23.0% per year) and France (+13.4% per year).
Export Prices by Country
In 2023, the dental instruments price amounted to $1.1 per unit (FOB, Netherlands), growing by 25% against the previous year. In general, the export price saw a buoyant increase. The pace of growth was the most pronounced in 2016 an increase of 70% against the previous year. The export price peaked at $1.4 per unit in 2018; however, from 2019 to 2023, the export prices failed to regain momentum.
Prices varied noticeably by country of destination: amid the top suppliers, the country with the highest price was the United States ($3.6 per unit), while the average price for exports to Romania ($0.5 per unit) was amongst the lowest.
From 2013 to 2023, the most notable rate of growth in terms of prices was recorded for supplies to Poland (+25.7%), while the prices for the other major destinations experienced more modest paces of growth.
This report provides an in-depth analysis of the dental instruments market in the Netherlands. Within it, you will discover the latest data on market trends and opportunities by country, consumption, production and price developments, as well as the global trade (imports and exports). The forecast exhibits the market prospects through 2030.
Product coverage:
- Prodcom 32501150 - Instruments and appliances used in dental sciences (excluding drill engines)
Country coverage:
- Netherlands
Data coverage:
- Market volume and value
- Per Capita consumption
- Forecast of the market dynamics in the medium term
- Trade (exports and imports) in the Netherlands
- Export and import prices
- Market trends, drivers and restraints
- Key market players and their profiles
Reasons to buy this report:
- Take advantage of the latest data
- Find deeper insights into current market developments
- Discover vital success factors affecting the market
This report is designed for manufacturers, distributors, importers, and wholesalers, as well as for investors, consultants and advisors.
In this report, you can find information that helps you to make informed decisions on the following issues:
- How to diversify your business and benefit from new market opportunities
- How to load your idle production capacity
- How to boost your sales on overseas markets
- How to increase your profit margins
- How to make your supply chain more sustainable
- How to reduce your production and supply chain costs
- How to outsource production to other countries
- How to prepare your business for global expansion
While doing this research, we combine the accumulated expertise of our analysts and the capabilities of artificial intelligence. The AI-based platform, developed by our data scientists, constitutes the key working tool for business analysts, empowering them to discover deep insights and ideas from the marketing data.
-
1. INTRODUCTION
Making Data-Driven Decisions to Grow Your Business
- REPORT DESCRIPTION
- RESEARCH METHODOLOGY AND AI PLATFORM
- DATA-DRIVEN DECISIONS FOR YOUR BUSINESS
- GLOSSARY AND SPECIFIC TERMS
-
2. EXECUTIVE SUMMARY
A Quick Overview of Market Performance
- KEY FINDINGS
- MARKET TRENDS This Chapter is Available Only for the Professional Edition PRO
-
3. MARKET OVERVIEW
Understanding the Current State of The Market and Its Prospects
- MARKET SIZE
- MARKET STRUCTURE
- TRADE BALANCE
- PER CAPITA CONSUMPTION
- MARKET FORECAST TO 2030
-
4. MOST PROMISING PRODUCT
Finding New Products to Diversify Your Business
This Chapter is Available Only for the Professional Edition PRO- TOP PRODUCTS TO DIVERSIFY YOUR BUSINESS
- BEST-SELLING PRODUCTS
- MOST CONSUMED PRODUCT
- MOST TRADED PRODUCT
- MOST PROFITABLE PRODUCT FOR EXPORT
-
5. MOST PROMISING SUPPLYING COUNTRIES
Choosing the Best Countries to Establish Your Sustainable Supply Chain
This Chapter is Available Only for the Professional Edition PRO- TOP COUNTRIES TO SOURCE YOUR PRODUCT
- TOP PRODUCING COUNTRIES
- TOP EXPORTING COUNTRIES
- LOW-COST EXPORTING COUNTRIES
-
6. MOST PROMISING OVERSEAS MARKETS
Choosing the Best Countries to Boost Your Exports
This Chapter is Available Only for the Professional Edition PRO- TOP OVERSEAS MARKETS FOR EXPORTING YOUR PRODUCT
- TOP CONSUMING MARKETS
- UNSATURATED MARKETS
- TOP IMPORTING MARKETS
- MOST PROFITABLE MARKETS
7. PRODUCTION
The Latest Trends and Insights into The Industry
- PRODUCTION VOLUME AND VALUE
8. IMPORTS
The Largest Import Supplying Countries
- IMPORTS FROM 2012–2023
- IMPORTS BY COUNTRY
- IMPORT PRICES BY COUNTRY
9. EXPORTS
The Largest Destinations for Exports
- EXPORTS FROM 2012–2023
- EXPORTS BY COUNTRY
- EXPORT PRICES BY COUNTRY
-
10. PROFILES OF MAJOR PRODUCERS
The Largest Producers on The Market and Their Profiles
This Chapter is Available Only for the Professional Edition PRO -
LIST OF TABLES
- Key Findings In 2023
- Market Volume, In Physical Terms, 2012–2023
- Market Value, 2012–2023
- Per Capita Consumption In 2012-2023
- Imports, In Physical Terms, By Country, 2012–2023
- Imports, In Value Terms, By Country, 2012–2023
- Import Prices, By Country Of Origin, 2012–2023
- Exports, In Physical Terms, By Country, 2012–2023
- Exports, In Value Terms, By Country, 2012–2023
- Export Prices, By Country Of Destination, 2012–2023
-
LIST OF FIGURES
- Market Volume, In Physical Terms, 2012–2023
- Market Value, 2012–2023
- Market Structure – Domestic Supply vs. Imports, In Physical Terms, 2012-2023
- Market Structure – Domestic Supply vs. Imports, In Value Terms, 2012-2023
- Trade Balance, In Physical Terms, 2012-2023
- Trade Balance, In Value Terms, 2012-2023
- Per Capita Consumption, 2012-2023
- Market Volume Forecast to 2030
- Market Value Forecast to 2030
- Products: Market Size And Growth, By Type
- Products: Average Per Capita Consumption, By Type
- Products: Exports And Growth, By Type
- Products: Export Prices And Growth, By Type
- Production Volume And Growth
- Exports And Growth
- Export Prices And Growth
- Market Size And Growth
- Per Capita Consumption
- Imports And Growth
- Import Prices
- Production, In Physical Terms, 2012–2023
- Production, In Value Terms, 2012–2023
- Imports, In Physical Terms, 2012–2023
- Imports, In Value Terms, 2012–2023
- Imports, In Physical Terms, By Country, 2023
- Imports, In Physical Terms, By Country, 2012–2023
- Imports, In Value Terms, By Country, 2012–2023
- Import Prices, By Country Of Origin, 2012–2023
- Exports, In Physical Terms, 2012–2023
- Exports, In Value Terms, 2012–2023
- Exports, In Physical Terms, By Country, 2023
- Exports, In Physical Terms, By Country, 2012–2023
- Exports, In Value Terms, By Country, 2012–2023
- Export Prices, By Country Of Destination, 2012–2023


