Netherlands - Potato Chips - Market Analysis, Forecast, Size, Trends And Insights
Get instant access to more than 2 million reports, dashboards, and datasets on the IndexBox Platform.
View PricingAugust 2023 Witnesses a 6% Surge in Export Earnings From Potato Chips in the Netherlands, Reaching $53M.
Netherlands Potato Chips Exports
In August 2023, shipments abroad of potato chips was finally on the rise to reach 27K tons for the first time since May 2023, thus ending a two-month declining trend. Over the period under review, exports, however, continue to indicate a relatively flat trend pattern. The pace of growth was the most pronounced in May 2023 with an increase of 21% against the previous month. As a result, the exports attained the peak of 28K tons. From June 2023 to August 2023, the growth of the exports failed to regain momentum.
In value terms, potato chips exports rose remarkably to $53M (IndexBox estimates) in August 2023. The total export value increased at an average monthly rate of +2.6% from August 2022 to August 2023; the trend pattern indicated some noticeable fluctuations being recorded in certain months. The pace of growth appeared the most rapid in May 2023 with an increase of 18% month-to-month.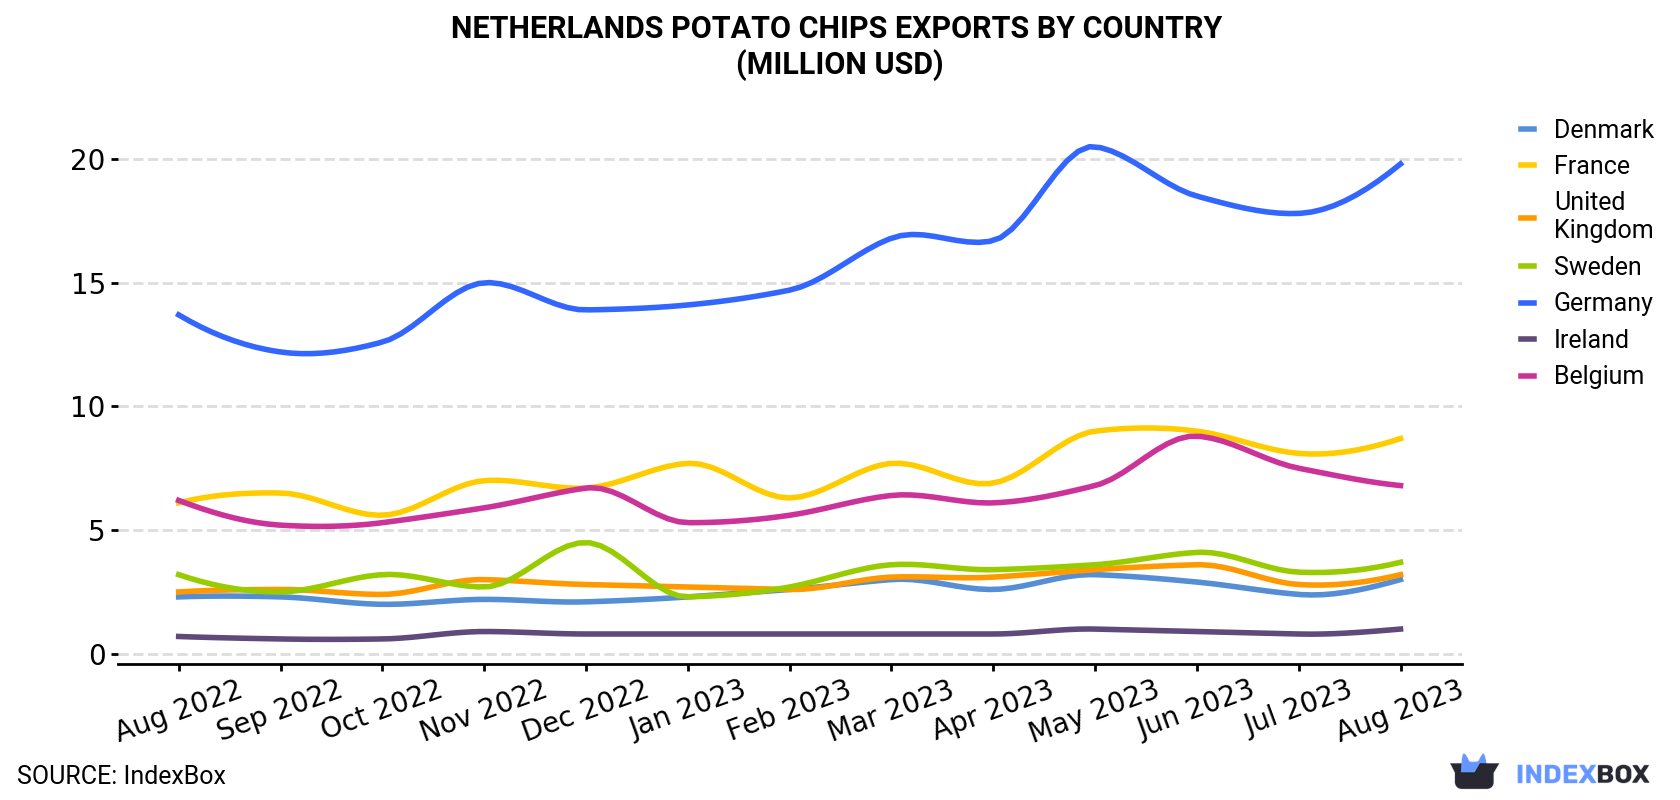
| COUNTRY | Export Value of Potato Chips in Netherlands (million USD) | ||||||||||||
|---|---|---|---|---|---|---|---|---|---|---|---|---|---|
| Aug 2022 | Sep 2022 | Oct 2022 | Nov 2022 | Dec 2022 | Jan 2023 | Feb 2023 | Mar 2023 | Apr 2023 | May 2023 | Jun 2023 | Jul 2023 | Aug 2023 | |
| Germany | 13.7 | 12.2 | 12.6 | 15.0 | 13.9 | 14.1 | 14.7 | 16.8 | 16.7 | 20.5 | 18.5 | 17.8 | 19.8 |
| France | 6.1 | 6.5 | 5.6 | 7.0 | 6.7 | 7.7 | 6.3 | 7.7 | 6.9 | 9.0 | 9.0 | 8.1 | 8.7 |
| Belgium | 6.2 | 5.2 | 5.3 | 5.9 | 6.7 | 5.3 | 5.6 | 6.4 | 6.1 | 6.8 | 8.8 | 7.5 | 6.8 |
| Sweden | 3.2 | 2.5 | 3.2 | 2.7 | 4.5 | 2.3 | 2.7 | 3.6 | 3.4 | 3.6 | 4.1 | 3.3 | 3.7 |
| United Kingdom | 2.5 | 2.6 | 2.4 | 3.0 | 2.8 | 2.7 | 2.6 | 3.1 | 3.1 | 3.4 | 3.6 | 2.8 | 3.2 |
| Denmark | 2.3 | 2.3 | 2.0 | 2.2 | 2.1 | 2.3 | 2.6 | 3.0 | 2.6 | 3.2 | 2.9 | 2.4 | 3.0 |
| Ireland | 0.7 | 0.6 | 0.6 | 0.9 | 0.8 | 0.8 | 0.8 | 0.8 | 0.8 | 1.0 | 0.9 | 0.8 | 1.0 |
| Others | 3.8 | 4.0 | 4.3 | 4.7 | 4.7 | 4.8 | 5.1 | 6.0 | 5.9 | 6.3 | 6.6 | 6.9 | 6.5 |
| Total | 38.5 | 35.9 | 36.2 | 41.4 | 42.1 | 39.9 | 40.3 | 47.4 | 45.5 | 53.8 | 54.4 | 49.6 | 52.7 |
Exports by Country
Germany (11K tons) was the main destination for potato chips exports from the Netherlands, accounting for a 41% share of total exports. Moreover, potato chips exports to Germany exceeded the volume sent to the second major destination, France (5.2K tons), twofold. Belgium (3K tons) ranked third in terms of total exports with an 11% share.
From August 2022 to August 2023, the average monthly growth rate of volume to Germany was relatively modest. Exports to the other major destinations recorded the following average monthly rates of exports growth: France (+0.2% per month) and Belgium (-1.8% per month).
In value terms, Germany ($20M) remains the key foreign market for potato chips exports from the Netherlands, comprising 38% of total exports. The second position in the ranking was taken by France ($8.7M), with a 17% share of total exports. It was followed by Belgium, with a 13% share.
From August 2022 to August 2023, the average monthly rate of growth in terms of value to Germany amounted to +3.1%. Exports to the other major destinations recorded the following average monthly rates of exports growth: France (+3.1% per month) and Belgium (+0.8% per month).
Export Prices by Country
In August 2023, the potato chips price amounted to $1,976 per ton (FOB, Netherlands), shrinking by -2.6% against the previous month. Over the last twelve months, it increased at an average monthly rate of +2.8%. The pace of growth was the most pronounced in October 2022 an increase of 12% month-to-month. Over the period under review, the average export prices attained the peak figure at $2,029 per ton in July 2023, and then dropped modestly in the following month.
Prices varied noticeably by the country of destination: the country with the highest price was Denmark ($2,807 per ton), while the average price for exports to the UK ($1,560 per ton) was amongst the lowest.
From August 2022 to August 2023, the most notable rate of growth in terms of prices was recorded for supplies to the UK (+3.1%), while the prices for the other major destinations experienced more modest paces of growth.
This report provides an in-depth analysis of the potato chips market in the Netherlands. Within it, you will discover the latest data on market trends and opportunities by country, consumption, production and price developments, as well as the global trade (imports and exports). The forecast exhibits the market prospects through 2030.
Product coverage:
- Prodcom 10311430 - Potatoes prepared or preserved in the form of flour, meal or flakes (excluding frozen, crisps, by vinegar or acetic acid)
- Prodcom 10311460 - Potatoes prepared or preserved, including crisps (excluding frozen, dried, by vinegar or acetic acid, in the form of flour, m eal or flakes)
Country coverage:
- Netherlands
Data coverage:
- Market volume and value
- Per Capita consumption
- Forecast of the market dynamics in the medium term
- Trade (exports and imports) in the Netherlands
- Export and import prices
- Market trends, drivers and restraints
- Key market players and their profiles
Reasons to buy this report:
- Take advantage of the latest data
- Find deeper insights into current market developments
- Discover vital success factors affecting the market
This report is designed for manufacturers, distributors, importers, and wholesalers, as well as for investors, consultants and advisors.
In this report, you can find information that helps you to make informed decisions on the following issues:
- How to diversify your business and benefit from new market opportunities
- How to load your idle production capacity
- How to boost your sales on overseas markets
- How to increase your profit margins
- How to make your supply chain more sustainable
- How to reduce your production and supply chain costs
- How to outsource production to other countries
- How to prepare your business for global expansion
While doing this research, we combine the accumulated expertise of our analysts and the capabilities of artificial intelligence. The AI-based platform, developed by our data scientists, constitutes the key working tool for business analysts, empowering them to discover deep insights and ideas from the marketing data.
-
1. INTRODUCTION
Making Data-Driven Decisions to Grow Your Business
- REPORT DESCRIPTION
- RESEARCH METHODOLOGY AND AI PLATFORM
- DATA-DRIVEN DECISIONS FOR YOUR BUSINESS
- GLOSSARY AND SPECIFIC TERMS
-
2. EXECUTIVE SUMMARY
A Quick Overview of Market Performance
- KEY FINDINGS
- MARKET TRENDS This Chapter is Available Only for the Professional Edition PRO
-
3. MARKET OVERVIEW
Understanding the Current State of The Market and Its Prospects
- MARKET SIZE
- MARKET STRUCTURE
- TRADE BALANCE
- PER CAPITA CONSUMPTION
- MARKET FORECAST TO 2030
-
4. MOST PROMISING PRODUCT
Finding New Products to Diversify Your Business
This Chapter is Available Only for the Professional Edition PRO- TOP PRODUCTS TO DIVERSIFY YOUR BUSINESS
- BEST-SELLING PRODUCTS
- MOST CONSUMED PRODUCT
- MOST TRADED PRODUCT
- MOST PROFITABLE PRODUCT FOR EXPORT
-
5. MOST PROMISING SUPPLYING COUNTRIES
Choosing the Best Countries to Establish Your Sustainable Supply Chain
This Chapter is Available Only for the Professional Edition PRO- TOP COUNTRIES TO SOURCE YOUR PRODUCT
- TOP PRODUCING COUNTRIES
- TOP EXPORTING COUNTRIES
- LOW-COST EXPORTING COUNTRIES
-
6. MOST PROMISING OVERSEAS MARKETS
Choosing the Best Countries to Boost Your Exports
This Chapter is Available Only for the Professional Edition PRO- TOP OVERSEAS MARKETS FOR EXPORTING YOUR PRODUCT
- TOP CONSUMING MARKETS
- UNSATURATED MARKETS
- TOP IMPORTING MARKETS
- MOST PROFITABLE MARKETS
7. PRODUCTION
The Latest Trends and Insights into The Industry
- PRODUCTION VOLUME AND VALUE
8. IMPORTS
The Largest Import Supplying Countries
- IMPORTS FROM 2012–2023
- IMPORTS BY COUNTRY
- IMPORT PRICES BY COUNTRY
9. EXPORTS
The Largest Destinations for Exports
- EXPORTS FROM 2012–2023
- EXPORTS BY COUNTRY
- EXPORT PRICES BY COUNTRY
-
10. PROFILES OF MAJOR PRODUCERS
The Largest Producers on The Market and Their Profiles
This Chapter is Available Only for the Professional Edition PRO -
LIST OF TABLES
- Key Findings In 2023
- Market Volume, In Physical Terms, 2012–2023
- Market Value, 2012–2023
- Per Capita Consumption In 2012-2023
- Imports, In Physical Terms, By Country, 2012–2023
- Imports, In Value Terms, By Country, 2012–2023
- Import Prices, By Country Of Origin, 2012–2023
- Exports, In Physical Terms, By Country, 2012–2023
- Exports, In Value Terms, By Country, 2012–2023
- Export Prices, By Country Of Destination, 2012–2023
-
LIST OF FIGURES
- Market Volume, In Physical Terms, 2012–2023
- Market Value, 2012–2023
- Market Structure – Domestic Supply vs. Imports, In Physical Terms, 2012-2023
- Market Structure – Domestic Supply vs. Imports, In Value Terms, 2012-2023
- Trade Balance, In Physical Terms, 2012-2023
- Trade Balance, In Value Terms, 2012-2023
- Per Capita Consumption, 2012-2023
- Market Volume Forecast to 2030
- Market Value Forecast to 2030
- Products: Market Size And Growth, By Type
- Products: Average Per Capita Consumption, By Type
- Products: Exports And Growth, By Type
- Products: Export Prices And Growth, By Type
- Production Volume And Growth
- Exports And Growth
- Export Prices And Growth
- Market Size And Growth
- Per Capita Consumption
- Imports And Growth
- Import Prices
- Production, In Physical Terms, 2012–2023
- Production, In Value Terms, 2012–2023
- Imports, In Physical Terms, 2012–2023
- Imports, In Value Terms, 2012–2023
- Imports, In Physical Terms, By Country, 2023
- Imports, In Physical Terms, By Country, 2012–2023
- Imports, In Value Terms, By Country, 2012–2023
- Import Prices, By Country Of Origin, 2012–2023
- Exports, In Physical Terms, 2012–2023
- Exports, In Value Terms, 2012–2023
- Exports, In Physical Terms, By Country, 2023
- Exports, In Physical Terms, By Country, 2012–2023
- Exports, In Value Terms, By Country, 2012–2023
- Export Prices, By Country Of Destination, 2012–2023


