Qatar - Mixed Fertilizers - Market Analysis, Forecast, Size, Trends And Insights
Get instant access to more than 2 million reports, dashboards, and datasets on the IndexBox Platform.
View PricingSignificant Decrease in Qatar's August 2023 Imports of Mixed Fertilizer, Amounting to $432K
Qatar Mixed Fertilizer Imports
In August 2023, purchases abroad of mixed fertilizers decreased by -28.6% to 289 tons, falling for the second consecutive month after two months of growth. In general, imports showed a pronounced contraction. The most prominent rate of growth was recorded in February 2023 when imports increased by 546% month-to-month.
In value terms, mixed fertilizer imports fell to $432K (IndexBox estimates) in August 2023. Overall, imports continue to indicate a pronounced decline. The pace of growth was the most pronounced in May 2023 with an increase of 212% m-o-m.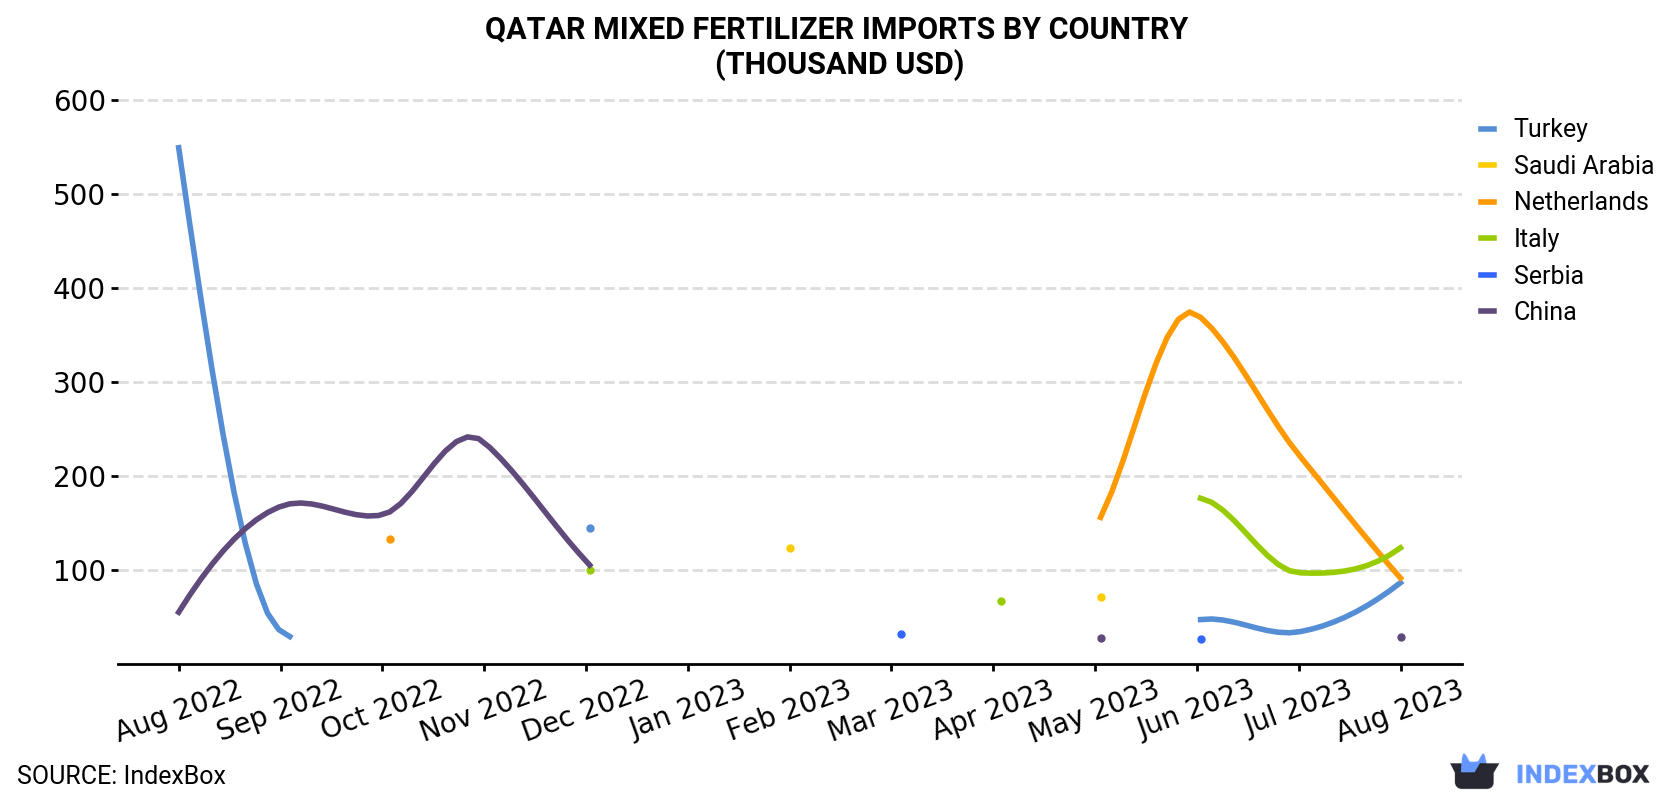
| COUNTRY | Import Value of Mixed Fertilizer in Qatar (thousand USD) | ||||||||||||
|---|---|---|---|---|---|---|---|---|---|---|---|---|---|
| Aug 2022 | Sep 2022 | Oct 2022 | Nov 2022 | Dec 2022 | Jan 2023 | Feb 2023 | Mar 2023 | Apr 2023 | May 2023 | Jun 2023 | Jul 2023 | Aug 2023 | |
| Italy | N/A | N/A | N/A | N/A | 100 | N/A | N/A | N/A | 67.6 | N/A | 177 | 97.5 | 124 |
| Netherlands | N/A | N/A | 133 | N/A | N/A | N/A | N/A | N/A | N/A | 146 | 372 | 223 | 91.9 |
| Turkey | 549 | 35.7 | N/A | N/A | 145 | N/A | N/A | N/A | N/A | N/A | 47.1 | 34.7 | 87.0 |
| China | 55.6 | 168 | 159 | 236 | 110 | N/A | N/A | N/A | N/A | 28.6 | N/A | N/A | 29.5 |
| Saudi Arabia | N/A | N/A | N/A | N/A | N/A | N/A | 124 | N/A | N/A | 72.0 | N/A | N/A | N/A |
| Serbia | N/A | N/A | N/A | N/A | N/A | N/A | N/A | 32.8 | N/A | N/A | 26.8 | N/A | N/A |
| Others | 63.0 | 242 | 63.6 | 424 | 85.0 | 53.6 | 40.8 | 178 | 69.7 | 182 | 257 | 136 | 99.5 |
| Total | 668 | 446 | 356 | 659 | 441 | 53.6 | 165 | 211 | 137 | 429 | 880 | 491 | 432 |
Imports by Country
In August 2023, Italy (144 tons) constituted the largest mixed fertilizer supplier to Qatar, accounting for a 50% share of total imports. Moreover, mixed fertilizer imports from Italy exceeded the figures recorded by the second-largest supplier, the Netherlands (48 tons), threefold. China (26 tons) ranked third in terms of total imports with an 8.8% share.
From August 2022 to August 2023, the average monthly growth rate of volume from Italy amounted to +5.2%. The remaining supplying countries recorded the following average monthly rates of imports growth: the Netherlands (-4.0% per month) and China (+0.5% per month).
In value terms, Italy ($124K), the Netherlands ($92K) and Turkey ($87K) constituted the largest mixed fertilizer suppliers to Qatar, with a combined 70% share of total imports.
In terms of the main suppliers, Italy, with a CAGR of +2.7%, recorded the highest growth rate of the value of imports, over the period under review, while purchases for the other leaders experienced a decline.
Imports by Type
In August 2023, mixed nitrogen, phosphorus and potassium (NPK) fertilizers (264 tons) was the main type of mixed fertilizer supplied to Qatar, with a 91% share of total imports. Moreover, mixed nitrogen, phosphorus and potassium (NPK) fertilizers exceeded the figures recorded for the second-largest type, monoammonium phosphate (MAP) (26 tons), tenfold.
From August 2022 to August 2023, the average monthly rate of growth in terms of the volume of import of mixed nitrogen, phosphorus and potassium (NPK) fertilizers amounted to -3.8%.
In value terms, mixed nitrogen, phosphorus and potassium (NPK) fertilizers ($402K) constituted the largest type of mixed fertilizer supplied to Qatar, comprising 93% of total imports. The second position in the ranking was held by monoammonium phosphate (MAP) ($30K), with a 6.8% share of total imports.
Import Prices by Country
In August 2023, the mixed fertilizer price amounted to $1,492 per ton (CIF, Qatar), with an increase of 23% against the previous month. Overall, the import price, however, recorded a relatively flat trend pattern. The pace of growth was the most pronounced in January 2023 when the average import price increased by 91% month-to-month. As a result, import price attained the peak level of $2,143 per ton. From February 2023 to August 2023, the average import prices remained at a lower figure.
Prices varied noticeably by the country of origin: the country with the highest price was Turkey ($7,247 per ton), while the price for Italy ($860 per ton) was amongst the lowest.
From August 2022 to August 2023, the most notable rate of growth in terms of prices was attained by Turkey (+14.2%), while the prices for the other major suppliers experienced more modest paces of growth.
This report provides an in-depth analysis of the mixed fertilizer market in Qatar. Within it, you will discover the latest data on market trends and opportunities by country, consumption, production and price developments, as well as the global trade (imports and exports). The forecast exhibits the market prospects through 2030.
Product coverage:
- Prodcom 20157130 -
- Prodcom 20157180 -
- Prodcom 20157200 - Diammonium hydrogenorthophosphate (diammonium phosphate) (excluding in tablets or similar forms or in packages of a weight of . .10 kg)
- Prodcom 20157300 - Ammonium dihydrogenorthophosphate (monoammonium phosphate)
- Prodcom 20157400 - Other mineral or chemical fertilisers containing the two fertilising elements nitrogen and phosphorus
- Prodcom 20157500 - Mineral or chemical fertilisers containing the two fertilising elements phosphorus and potassium
- Prodcom 20157100 - Mineral or chemical fertilisers containing the three fertilising elements nitrogen, phosphorus and potassium (excluding those in tablets or similar forms, or in packages with a gross weight of . .10 kg)
- Prodcom 20157200 - Diammonium hydrogenorthophosphate (diammonium phosphate) (excluding in tablets or similar forms or in packages of a weight of . .10 kg)
- Prodcom 20157300 - Ammonium dihydrogenorthophosphate (monoammonium phosphate)
- Prodcom 20157400 - Other mineral or chemical fertilisers containing the two fertilising elements nitrogen and phosphorus
- Prodcom 20157500 - Mineral or chemical fertilisers containing the two fertilising elements phosphorus and potassium
Country coverage:
- Qatar
Data coverage:
- Market volume and value
- Per Capita consumption
- Forecast of the market dynamics in the medium term
- Trade (exports and imports) in Qatar
- Export and import prices
- Market trends, drivers and restraints
- Key market players and their profiles
Reasons to buy this report:
- Take advantage of the latest data
- Find deeper insights into current market developments
- Discover vital success factors affecting the market
This report is designed for manufacturers, distributors, importers, and wholesalers, as well as for investors, consultants and advisors.
In this report, you can find information that helps you to make informed decisions on the following issues:
- How to diversify your business and benefit from new market opportunities
- How to load your idle production capacity
- How to boost your sales on overseas markets
- How to increase your profit margins
- How to make your supply chain more sustainable
- How to reduce your production and supply chain costs
- How to outsource production to other countries
- How to prepare your business for global expansion
While doing this research, we combine the accumulated expertise of our analysts and the capabilities of artificial intelligence. The AI-based platform, developed by our data scientists, constitutes the key working tool for business analysts, empowering them to discover deep insights and ideas from the marketing data.
-
1. INTRODUCTION
Making Data-Driven Decisions to Grow Your Business
- REPORT DESCRIPTION
- RESEARCH METHODOLOGY AND AI PLATFORM
- DATA-DRIVEN DECISIONS FOR YOUR BUSINESS
- GLOSSARY AND SPECIFIC TERMS
-
2. EXECUTIVE SUMMARY
A Quick Overview of Market Performance
- KEY FINDINGS
- MARKET TRENDS This Chapter is Available Only for the Professional Edition PRO
-
3. MARKET OVERVIEW
Understanding the Current State of The Market and Its Prospects
- MARKET SIZE
- MARKET STRUCTURE
- TRADE BALANCE
- PER CAPITA CONSUMPTION
- MARKET FORECAST TO 2030
-
4. MOST PROMISING PRODUCT
Finding New Products to Diversify Your Business
This Chapter is Available Only for the Professional Edition PRO- TOP PRODUCTS TO DIVERSIFY YOUR BUSINESS
- BEST-SELLING PRODUCTS
- MOST CONSUMED PRODUCT
- MOST TRADED PRODUCT
- MOST PROFITABLE PRODUCT FOR EXPORT
-
5. MOST PROMISING SUPPLYING COUNTRIES
Choosing the Best Countries to Establish Your Sustainable Supply Chain
This Chapter is Available Only for the Professional Edition PRO- TOP COUNTRIES TO SOURCE YOUR PRODUCT
- TOP PRODUCING COUNTRIES
- TOP EXPORTING COUNTRIES
- LOW-COST EXPORTING COUNTRIES
-
6. MOST PROMISING OVERSEAS MARKETS
Choosing the Best Countries to Boost Your Exports
This Chapter is Available Only for the Professional Edition PRO- TOP OVERSEAS MARKETS FOR EXPORTING YOUR PRODUCT
- TOP CONSUMING MARKETS
- UNSATURATED MARKETS
- TOP IMPORTING MARKETS
- MOST PROFITABLE MARKETS
7. PRODUCTION
The Latest Trends and Insights into The Industry
- PRODUCTION VOLUME AND VALUE
8. IMPORTS
The Largest Import Supplying Countries
- IMPORTS FROM 2012–2023
- IMPORTS BY COUNTRY
- IMPORT PRICES BY COUNTRY
9. EXPORTS
The Largest Destinations for Exports
- EXPORTS FROM 2012–2023
- EXPORTS BY COUNTRY
- EXPORT PRICES BY COUNTRY
-
10. PROFILES OF MAJOR PRODUCERS
The Largest Producers on The Market and Their Profiles
This Chapter is Available Only for the Professional Edition PRO -
LIST OF TABLES
- Key Findings In 2023
- Market Volume, In Physical Terms, 2012–2023
- Market Value, 2012–2023
- Per Capita Consumption In 2012-2023
- Imports, In Physical Terms, By Country, 2012–2023
- Imports, In Value Terms, By Country, 2012–2023
- Import Prices, By Country Of Origin, 2012–2023
- Exports, In Physical Terms, By Country, 2012–2023
- Exports, In Value Terms, By Country, 2012–2023
- Export Prices, By Country Of Destination, 2012–2023
-
LIST OF FIGURES
- Market Volume, In Physical Terms, 2012–2023
- Market Value, 2012–2023
- Market Structure – Domestic Supply vs. Imports, In Physical Terms, 2012-2023
- Market Structure – Domestic Supply vs. Imports, In Value Terms, 2012-2023
- Trade Balance, In Physical Terms, 2012-2023
- Trade Balance, In Value Terms, 2012-2023
- Per Capita Consumption, 2012-2023
- Market Volume Forecast to 2030
- Market Value Forecast to 2030
- Products: Market Size And Growth, By Type
- Products: Average Per Capita Consumption, By Type
- Products: Exports And Growth, By Type
- Products: Export Prices And Growth, By Type
- Production Volume And Growth
- Exports And Growth
- Export Prices And Growth
- Market Size And Growth
- Per Capita Consumption
- Imports And Growth
- Import Prices
- Production, In Physical Terms, 2012–2023
- Production, In Value Terms, 2012–2023
- Imports, In Physical Terms, 2012–2023
- Imports, In Value Terms, 2012–2023
- Imports, In Physical Terms, By Country, 2023
- Imports, In Physical Terms, By Country, 2012–2023
- Imports, In Value Terms, By Country, 2012–2023
- Import Prices, By Country Of Origin, 2012–2023
- Exports, In Physical Terms, 2012–2023
- Exports, In Value Terms, 2012–2023
- Exports, In Physical Terms, By Country, 2023
- Exports, In Physical Terms, By Country, 2012–2023
- Exports, In Value Terms, By Country, 2012–2023
- Export Prices, By Country Of Destination, 2012–2023


