Spain - Durum Wheat - Market Analysis, Forecast, Size, Trends and Insights
Get instant access to more than 2 million reports, dashboards, and datasets on the IndexBox Platform.
View PricingSpain's Import of Durum Wheat Reaches Record High of $298M in 2023
Spain Durum Wheat Imports
In 2023, durum wheat imports into Spain soared to 769K tons, increasing by 51% on 2022. In general, total imports indicated a strong expansion from 2013 to 2023: its volume increased at an average annual rate of +10.7% over the last decade. The trend pattern, however, indicated some noticeable fluctuations being recorded throughout the analyzed period. Based on 2023 figures, imports increased by +53.2% against 2020 indices. As a result, imports attained the peak and are likely to continue growth in the immediate term.
In value terms, durum wheat imports soared to $298M (IndexBox estimates) in 2023. Over the period under review, imports continue to indicate a buoyant increase. The growth pace was the most rapid in 2021 with an increase of 60%. Imports peaked in 2023 and are likely to continue growth in the near future.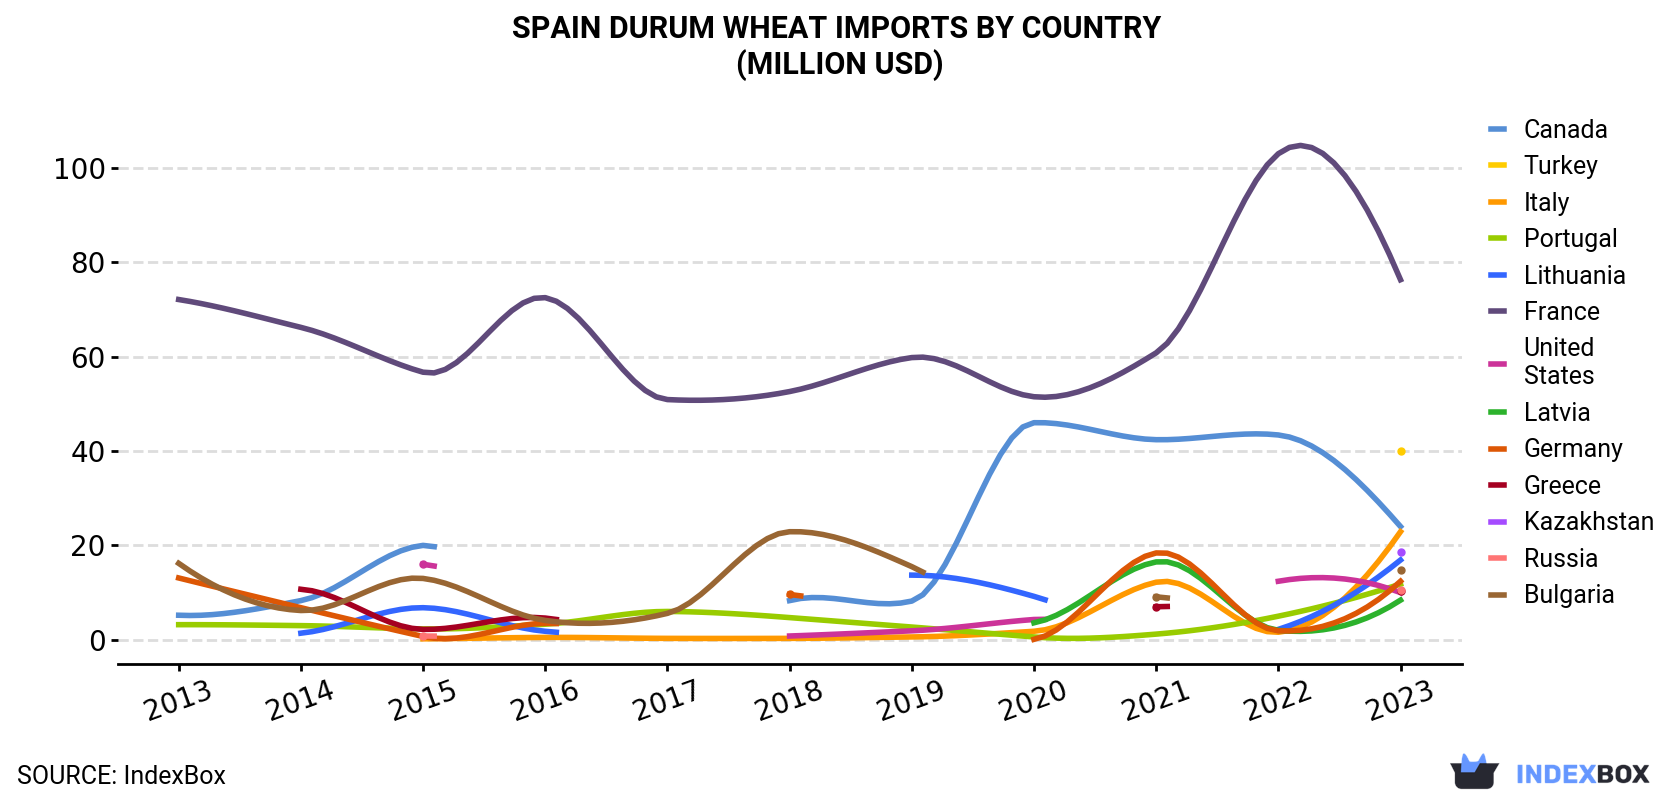
| COUNTRY | Import Value of Durum Wheat in Spain (million USD) | ||||||||||
|---|---|---|---|---|---|---|---|---|---|---|---|
| 2013 | 2014 | 2015 | 2016 | 2017 | 2018 | 2019 | 2020 | 2021 | 2022 | 2023 | |
| France | 72.1 | 66.2 | 56.7 | 72.5 | 50.9 | 52.6 | 59.8 | 51.5 | 60.8 | 103 | 76.3 |
| Turkey | N/A | N/A | N/A | N/A | N/A | N/A | N/A | N/A | N/A | N/A | 40.1 |
| Canada | 5.2 | 8.3 | 20.0 | N/A | N/A | 8.3 | 8.2 | 46.0 | 42.4 | 43.4 | 24.0 |
| Italy | N/A | N/A | 0.2 | 0.5 | 0.3 | 0.3 | 0.6 | 1.8 | 12.2 | 1.6 | 22.9 |
| Kazakhstan | N/A | N/A | N/A | N/A | N/A | N/A | N/A | N/A | N/A | N/A | 18.6 |
| Lithuania | N/A | 1.4 | 6.8 | 1.8 | N/A | N/A | 13.7 | 9.2 | N/A | 2.2 | 16.9 |
| Bulgaria | 16.2 | 6.2 | 13.0 | 4.1 | 5.6 | 22.9 | 15.5 | N/A | 9.1 | N/A | 14.7 |
| Germany | 13.1 | 6.8 | 0.7 | 3.5 | N/A | 9.6 | N/A | 0.1 | 18.4 | 1.9 | 12.4 |
| Portugal | 3.2 | 3.0 | 2.3 | 3.3 | 6.0 | 4.7 | 2.7 | 0.6 | 1.2 | 5.0 | 11.8 |
| Russia | N/A | N/A | 0.8 | N/A | N/A | N/A | N/A | N/A | N/A | N/A | 10.5 |
| Greece | N/A | 10.7 | 2.2 | 4.6 | N/A | N/A | N/A | N/A | 7.0 | N/A | 10.3 |
| United States | N/A | N/A | 16.0 | N/A | N/A | 0.8 | 1.9 | 4.3 | N/A | 12.4 | 10.0 |
| Latvia | N/A | N/A | N/A | N/A | N/A | N/A | N/A | 3.6 | 16.5 | 2.0 | 8.4 |
| Others | 6.4 | 28.5 | 29.2 | 26.2 | 22.1 | 18.8 | 21.8 | 16.9 | 46.7 | 42.0 | 20.8 |
| Total | 116 | 131 | 148 | 117 | 84.9 | 118 | 124 | 134 | 214 | 213 | 298 |
Imports by Country
In 2023, France (219K tons) constituted the largest durum wheat supplier to Spain, with a 28% share of total imports. Moreover, durum wheat imports from France exceeded the figures recorded by the second-largest supplier, Turkey (83K tons), threefold. Italy (59K tons) ranked third in terms of total imports with a 7.7% share.
From 2013 to 2023, the average annual growth rate of volume from France totaled +2.5%. The remaining supplying countries recorded the following average annual rates of imports growth: Turkey (+1,399.3% per year) and Italy (+106.0% per year).
In value terms, France ($76M), Turkey ($40M) and Canada ($24M) constituted the largest durum wheat suppliers to Spain, together accounting for 47% of total imports. Italy, Kazakhstan, Lithuania, Bulgaria, Germany, Portugal, Russia, Greece, the United States and Latvia lagged somewhat behind, together comprising a further 46%.
Kazakhstan, with a CAGR of +47,244.0%, saw the highest rates of growth with regard to the value of imports, among the main suppliers over the period under review, while purchases for the other leaders experienced more modest paces of growth.
Import Prices by Country
In 2023, the durum wheat price amounted to $387 per ton (CIF, Spain), waning by -7.7% against the previous year. In general, the import price showed a relatively flat trend pattern. The growth pace was the most rapid in 2021 when the average import price increased by 29% against the previous year. Over the period under review, average import prices attained the maximum at $419 per ton in 2022, and then dropped in the following year.
Prices varied noticeably by country of origin: amid the top importers, the country with the highest price was Turkey ($482 per ton), while the price for Germany ($258 per ton) was amongst the lowest.
From 2013 to 2023, the most notable rate of growth in terms of prices was attained by Turkey (+15.6%), while the prices for the other major suppliers experienced more modest paces of growth.
This report provides an in-depth analysis of the durum wheat market in Spain. Within it, you will discover the latest data on market trends and opportunities by country, consumption, production and price developments, as well as the global trade (imports and exports). The forecast exhibits the market prospects through 2030.
Product coverage:
- FCL 15 - Wheat
Country coverage:
- Spain
Data coverage:
- Market volume and value
- Per Capita consumption
- Forecast of the market dynamics in the medium term
- Trade (exports and imports) in Spain
- Export and import prices
- Market trends, drivers and restraints
- Key market players and their profiles
Reasons to buy this report:
- Take advantage of the latest data
- Find deeper insights into current market developments
- Discover vital success factors affecting the market
This report is designed for manufacturers, distributors, importers, and wholesalers, as well as for investors, consultants and advisors.
In this report, you can find information that helps you to make informed decisions on the following issues:
- How to diversify your business and benefit from new market opportunities
- How to load your idle production capacity
- How to boost your sales on overseas markets
- How to increase your profit margins
- How to make your supply chain more sustainable
- How to reduce your production and supply chain costs
- How to outsource production to other countries
- How to prepare your business for global expansion
While doing this research, we combine the accumulated expertise of our analysts and the capabilities of artificial intelligence. The AI-based platform, developed by our data scientists, constitutes the key working tool for business analysts, empowering them to discover deep insights and ideas from the marketing data.
-
1. INTRODUCTION
Making Data-Driven Decisions to Grow Your Business
- REPORT DESCRIPTION
- RESEARCH METHODOLOGY AND AI PLATFORM
- DATA-DRIVEN DECISIONS FOR YOUR BUSINESS
- GLOSSARY AND SPECIFIC TERMS
-
2. EXECUTIVE SUMMARY
A Quick Overview of Market Performance
- KEY FINDINGS
- MARKET TRENDS This Chapter is Available Only for the Professional Edition PRO
-
3. MARKET OVERVIEW
Understanding the Current State of The Market and Its Prospects
- MARKET SIZE
- MARKET STRUCTURE
- TRADE BALANCE
- PER CAPITA CONSUMPTION
- MARKET FORECAST TO 2030
-
4. MOST PROMISING PRODUCT
Finding New Products to Diversify Your Business
This Chapter is Available Only for the Professional Edition PRO- TOP PRODUCTS TO DIVERSIFY YOUR BUSINESS
- BEST-SELLING PRODUCTS
- MOST CONSUMED PRODUCT
- MOST TRADED PRODUCT
- MOST PROFITABLE PRODUCT FOR EXPORT
-
5. MOST PROMISING SUPPLYING COUNTRIES
Choosing the Best Countries to Establish Your Sustainable Supply Chain
This Chapter is Available Only for the Professional Edition PRO- TOP COUNTRIES TO SOURCE YOUR PRODUCT
- TOP PRODUCING COUNTRIES
- COUNTRIES WITH TOP YIELDS
- TOP EXPORTING COUNTRIES
- LOW-COST EXPORTING COUNTRIES
-
6. MOST PROMISING OVERSEAS MARKETS
Choosing the Best Countries to Boost Your Exports
This Chapter is Available Only for the Professional Edition PRO- TOP OVERSEAS MARKETS FOR EXPORTING YOUR PRODUCT
- TOP CONSUMING MARKETS
- UNSATURATED MARKETS
- TOP IMPORTING MARKETS
- MOST PROFITABLE MARKETS
7. PRODUCTION
The Latest Trends and Insights into The Industry
- PRODUCTION, HARVESTED AREA AND YIELD
8. IMPORTS
The Largest Import Supplying Countries
- IMPORTS FROM 2012–2023
- IMPORTS BY COUNTRY
- IMPORT PRICES BY COUNTRY
9. EXPORTS
The Largest Destinations for Exports
- EXPORTS FROM 2012–2023
- EXPORTS BY COUNTRY
- EXPORT PRICES BY COUNTRY
-
10. PROFILES OF MAJOR PRODUCERS
The Largest Producers on The Market and Their Profiles
This Chapter is Available Only for the Professional Edition PRO -
LIST OF TABLES
- Key Findings In 2023
- Market Volume, In Physical Terms, 2012–2023
- Market Value, 2012–2023
- Per Capita Consumption In 2012-2023
- Imports, In Physical Terms, By Country, 2012–2023
- Imports, In Value Terms, By Country, 2012–2023
- Import Prices, By Country Of Origin, 2012–2023
- Exports, In Physical Terms, By Country, 2012–2023
- Exports, In Value Terms, By Country, 2012–2023
- Export Prices, By Country Of Destination, 2012–2023
-
LIST OF FIGURES
- Market Volume, In Physical Terms, 2012–2023
- Market Value, 2012–2023
- Market Structure – Domestic Supply vs. Imports, In Physical Terms, 2012-2023
- Market Structure – Domestic Supply vs. Imports, In Value Terms, 2012-2023
- Trade Balance, In Physical Terms, 2012-2023
- Trade Balance, In Value Terms, 2012-2023
- Per Capita Consumption, 2012-2023
- Market Volume Forecast to 2030
- Market Value Forecast to 2030
- Products: Market Size And Growth, By Type
- Products: Average Per Capita Consumption, By Type
- Products: Exports And Growth, By Type
- Products: Export Prices And Growth, By Type
- Production Volume And Growth
- Yield And Growth
- Exports And Growth
- Export Prices And Growth
- Market Size And Growth
- Per Capita Consumption
- Imports And Growth
- Import Prices
- Production, In Physical Terms, 2012–2023
- Production, In Value Terms, 2012–2023
- Area Harvested, 2012–2023
- Yield, 2012–2023
- Imports, In Physical Terms, 2012–2023
- Imports, In Value Terms, 2012–2023
- Imports, In Physical Terms, By Country, 2023
- Imports, In Physical Terms, By Country, 2012–2023
- Imports, In Value Terms, By Country, 2012–2023
- Import Prices, By Country Of Origin, 2012–2023
- Exports, In Physical Terms, 2012–2023
- Exports, In Value Terms, 2012–2023
- Exports, In Physical Terms, By Country, 2023
- Exports, In Physical Terms, By Country, 2012–2023
- Exports, In Value Terms, By Country, 2012–2023
- Export Prices, By Country Of Destination, 2012–2023


