
Thailand - Folding Boxboard - Market Analysis, Forecast, Size, Trends and Insights
Get instant access to more than 2 million reports, dashboards, and datasets on the IndexBox Platform.
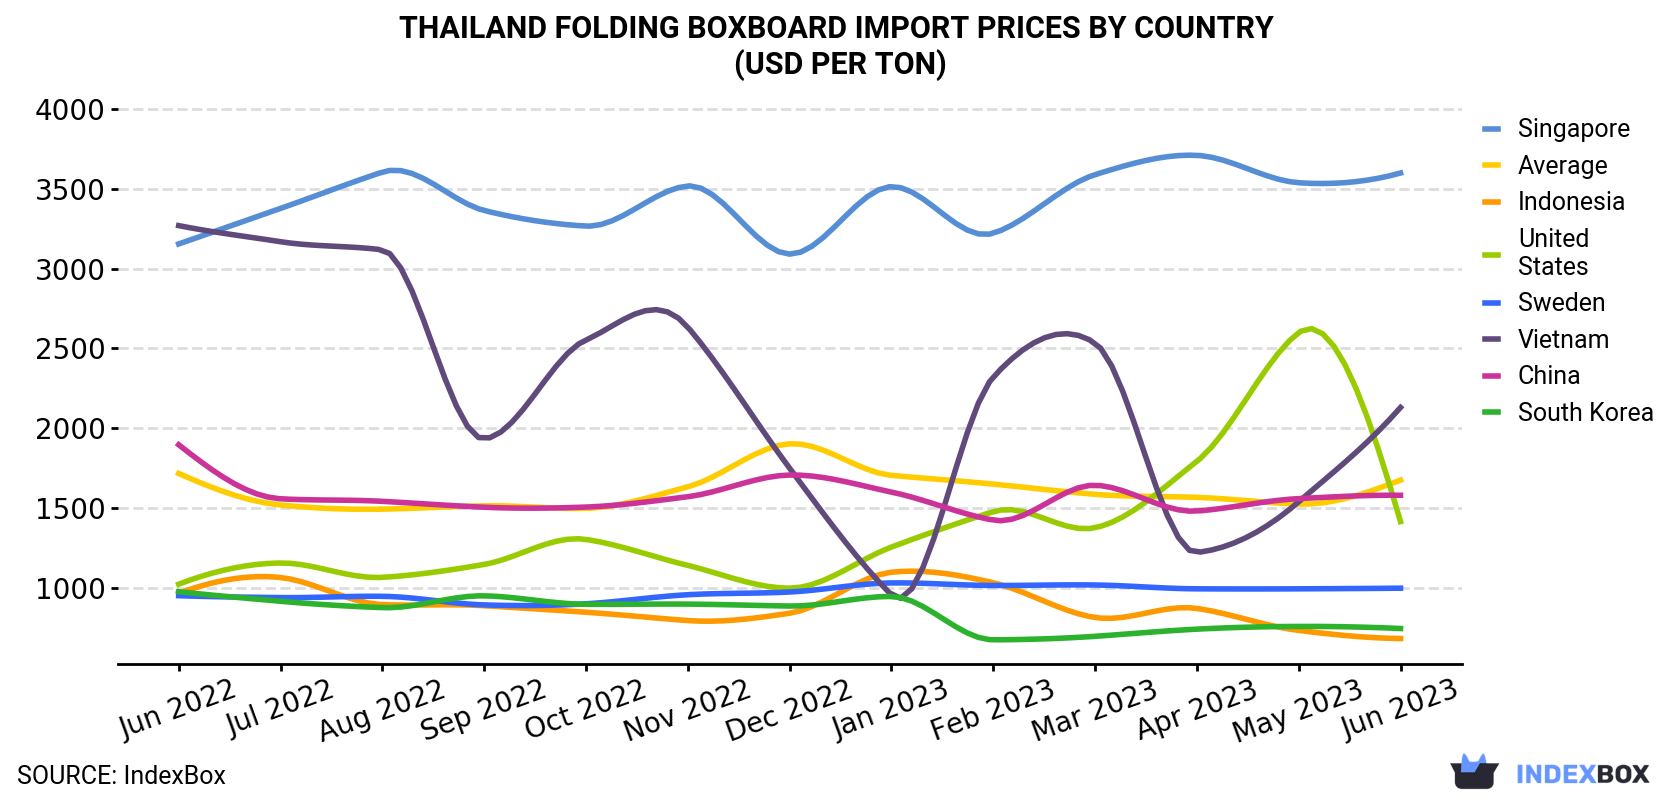
View PricingModest Increase in Price of Folding Boxboard in Thailand: $1,674 per Ton
Thailand Folding Boxboard Import Price in June 2023
In June 2023, the folding boxboard price stood at $1,674 per ton (CIF, Thailand), rising by 9.8% against the previous month. In general, the import price, however, recorded a relatively flat trend pattern. The growth pace was the most rapid in December 2022 when the average import price increased by 17% month-to-month. As a result, import price reached the peak level of $1,902 per ton. From January 2023 to June 2023, the average import prices remained at a somewhat lower figure.
There were significant differences in the average prices amongst the major supplying countries. In June 2023, the country with the highest price was Singapore ($3,601 per ton), while the price for Indonesia ($680 per ton) was amongst the lowest.
From June 2022 to June 2023, the most notable rate of growth in terms of prices was attained by the United States (+2.8%), while the prices for the other major suppliers experienced more modest paces of growth.
| COUNTRY | Import Price of Folding Boxboard in Thailand (USD per ton) | ||||||||||||
|---|---|---|---|---|---|---|---|---|---|---|---|---|---|
| Jun 2022 | Jul 2022 | Aug 2022 | Sep 2022 | Oct 2022 | Nov 2022 | Dec 2022 | Jan 2023 | Feb 2023 | Mar 2023 | Apr 2023 | May 2023 | Jun 2023 | |
| Singapore | 3,156 | 3,379 | 3,607 | 3,366 | 3,268 | 3,520 | 3,092 | 3,516 | 3,223 | 3,591 | 3,712 | 3,540 | 3,601 |
| Vietnam | 3,271 | 3,170 | 3,119 | 1,933 | 2,554 | 2,634 | 1,749 | 954 | 2,321 | 2,534 | 1,220 | 1,538 | 2,130 |
| China | 1,896 | 1,557 | 1,541 | 1,504 | 1,505 | 1,570 | 1,706 | 1,599 | 1,423 | 1,642 | 1,480 | 1,558 | 1,579 |
| United States | 1,021 | 1,154 | 1,064 | 1,145 | 1,302 | 1,139 | 996 | 1,254 | 1,476 | 1,375 | 1,792 | 2,600 | 1,414 |
| Sweden | 949 | 937 | 945 | 891 | 898 | 955 | 972 | 1,029 | 1,013 | 1,016 | 992 | 992 | 996 |
| South Korea | 974 | 914 | 874 | 948 | 895 | 896 | 884 | 944 | 672 | 694 | 739 | 756 | 743 |
| Indonesia | 964 | 1,063 | 893 | 886 | 845 | 793 | 839 | 1,096 | 1,030 | 812 | 869 | 731 | 680 |
| Average | 1,716 | 1,518 | 1,492 | 1,513 | 1,497 | 1,632 | 1,902 | 1,704 | 1,649 | 1,585 | 1,566 | 1,524 | 1,674 |
Thailand Folding Boxboard Import Prices by Type
There were significant differences in the average prices amongst the major supplied products. In June 2023, the product with the highest price was kraft paper and paperboard; uncoated, weight more than 150g/m2 but less than 225g/m2, in rolls or sheets, n.e.s. in item no. 4804.4, other than that of heading no. 4802 or 4803 ($50,192 per ton), while the price for paper and paperboard; uncoated, weight more than 150g/m2 but less than 225 g/m2, in rolls or sheets, n.e.c. in heading no. 4805 ($729 per ton) was amongst the lowest.
From June 2022 to June 2023, the most notable rate of growth in terms of prices was attained by kraft paper and paperboard; uncoated, weight more than 150g/m2 but less than 225g/m2, in rolls or sheets, n.e.s. in item no. 4804.4, other than that of heading no. 4802 or 4803 (+40.2%), while the prices for the other products experienced more modest paces of growth.
Thailand Folding Boxboard Imports
In June 2023, approximately 23K tons of folding boxboard were imported into Thailand; which is down by -19.7% on the previous month's figure. Overall, imports showed a slight setback. The pace of growth appeared the most rapid in May 2023 with an increase of 37% against the previous month. As a result, imports reached the peak of 29K tons, and then fell dramatically in the following month.
In value terms, folding boxboard imports shrank to $39M (IndexBox estimates) in June 2023. Over the period under review, imports recorded a mild downturn. The growth pace was the most rapid in May 2023 with an increase of 34% against the previous month.
Thailand Folding Boxboard Imports by Type
Paper and paperboard; multi-ply, coated with kaolin or other inorganic substances only, for non-graphic purposes, n.e.c. in heading no. 4810, in rolls or sheets (12K tons), paper and paperboard, surface-coloured, surface-decorated or printed, coated, impregnated or covered with artificial resins or plastics, in rolls or in square or rectangular sheets, of any size (excluding bleached and weighing > 150 g/m², and adhesives) (7.2K tons) and paper and paperboard; uncoated, weight more than 150g/m2 but less than 225 g/m2, in rolls or sheets, n.e.c. in heading no. 4805 (1.6K tons) were the main products of folding boxboard imports to Thailand, with a combined 89% share of total imports. These products were followed by paper and paperboard, surface-coloured, surface-decorated or printed, coated, impregnated or covered with artificial resins or plastics, in rolls or in square or rectangular sheets, of any size, bleached and weighing > 150 g/m² , kraft paper and paperboard, coated on one or both sides with kaolin or other inorganic substances, in rolls or in square or rectangular sheets, of any size (excluding that for writing, printing or other graphic purposes; paper and paperboard bleached uniformly in the mass and containing > 95% chemically processed wood fibres by weight in relation to the total fibre content), kraft paper and paperboard; uncoated, unbleached, weight 225g/m2 or more, in rolls or sheets, other than that of heading no. 4802 or 4803, kraft paper and paperboard, bleached uniformly throughout the mass and containing > 95% chemically processed wood fibres by weight in relation to the total fibre content, coated on one or both sides with kaolin or other inorganic substances, in rolls or in square or rectangular sheets, of any size, weighing > 150 g/m² , kraft paper and paperboard; uncoated, weight 225g/m2 or more, bleached uniformly throughout, more than 95% of total fibre content consists of chemically processed wood fibres, in rolls or sheets, kraft paper and paperboard; uncoated, weight between 150 and 225g/m2, bleached uniformly throughout, more than 95% of total fibre content consists of chemically processed wood fibres, in rolls or sheets, kraft paper and paperboard; uncoated, weight 225g/m2 or more, in rolls or sheets, n.e.s. in item no. 4804.5, other than that of heading no. 4802 or 4803 and kraft paper and paperboard; uncoated, weight more than 150g/m2 but less than 225g/m2, in rolls or sheets, n.e.s. in item no. 4804.4, other than that of heading no. 4802 or 4803, which together accounted for a further 11%.
From June 2022 to June 2023, the most notable rate of growth in terms of purchases, amongst the major product types, was attained by kraft paper and paperboard; coated with kaolin or other inorganic substances only, for non-graphic purposes, n.e.s. in item no. 4810.31 and 4810.32, in rolls or sheets (with a CAGR of +13.2%), while imports for the other products experienced more modest paces of growth.
In value terms, paper and paperboard, surface-coloured, surface-decorated or printed, coated, impregnated or covered with artificial resins or plastics, in rolls or in square or rectangular sheets, of any size (excluding bleached and weighing > 150 g/m², and adhesives) ($23M) constituted the largest type of folding boxboard supplied to Thailand, comprising 58% of total imports. The second position in the ranking was held by paper and paperboard; multi-ply, coated with kaolin or other inorganic substances only, for non-graphic purposes, n.e.c. in heading no. 4810, in rolls or sheets ($9.8M), with a 25% share of total imports. It was followed by paper and paperboard, surface-coloured, surface-decorated or printed, coated, impregnated or covered with artificial resins or plastics, in rolls or in square or rectangular sheets, of any size, bleached and weighing > 150 g/m² , with an 8.5% share.
Thailand Folding Boxboard Imports by Country
Sweden (5.4K tons), China (5.3K tons) and South Korea (3.4K tons) were the main suppliers of folding boxboard imports to Thailand, together comprising 60% of total imports. Singapore, Japan, Indonesia, the United States, Vietnam and Taiwan (Chinese) lagged somewhat behind, together comprising a further 32%.
From June 2022 to June 2023, the biggest increases were in Taiwan (Chinese) (with a CAGR of +2.1%), while purchases for the other leaders experienced more modest paces of growth.
In value terms, the largest folding boxboard suppliers to Thailand were Singapore ($12M), China ($8.3M) and Sweden ($5.4M), with a combined 66% share of total imports. South Korea, Japan, Vietnam, the United States, Indonesia and Taiwan (Chinese) lagged somewhat behind, together accounting for a further 20%.
In terms of the main suppliers, Taiwan (Chinese), with a CAGR of +3.5%, recorded the highest growth rate of the value of imports, over the period under review, while purchases for the other leaders experienced mixed trend patterns.
This report provides an in-depth analysis of the folding boxboard market in Thailand. Within it, you will discover the latest data on market trends and opportunities by country, consumption, production and price developments, as well as the global trade (imports and exports). The forecast exhibits the market prospects through 2030.
Product coverage:
- FCL 1618 - Cartonboard
Country coverage:
- Thailand
Data coverage:
- Market volume and value
- Per Capita consumption
- Forecast of the market dynamics in the medium term
- Trade (exports and imports) in Thailand
- Export and import prices
- Market trends, drivers and restraints
- Key market players and their profiles
Reasons to buy this report:
- Take advantage of the latest data
- Find deeper insights into current market developments
- Discover vital success factors affecting the market
This report is designed for manufacturers, distributors, importers, and wholesalers, as well as for investors, consultants and advisors.
In this report, you can find information that helps you to make informed decisions on the following issues:
- How to diversify your business and benefit from new market opportunities
- How to load your idle production capacity
- How to boost your sales on overseas markets
- How to increase your profit margins
- How to make your supply chain more sustainable
- How to reduce your production and supply chain costs
- How to outsource production to other countries
- How to prepare your business for global expansion
While doing this research, we combine the accumulated expertise of our analysts and the capabilities of artificial intelligence. The AI-based platform, developed by our data scientists, constitutes the key working tool for business analysts, empowering them to discover deep insights and ideas from the marketing data.
-
1. INTRODUCTION
Making Data-Driven Decisions to Grow Your Business
- REPORT DESCRIPTION
- RESEARCH METHODOLOGY AND AI PLATFORM
- DATA-DRIVEN DECISIONS FOR YOUR BUSINESS
- GLOSSARY AND SPECIFIC TERMS
-
2. EXECUTIVE SUMMARY
A Quick Overview of Market Performance
- KEY FINDINGS
- MARKET TRENDS This Chapter is Available Only for the Professional Edition PRO
-
3. MARKET OVERVIEW
Understanding the Current State of The Market and Its Prospects
- MARKET SIZE
- MARKET STRUCTURE
- TRADE BALANCE
- PER CAPITA CONSUMPTION
- MARKET FORECAST TO 2030
-
4. MOST PROMISING PRODUCT
Finding New Products to Diversify Your Business
This Chapter is Available Only for the Professional Edition PRO- TOP PRODUCTS TO DIVERSIFY YOUR BUSINESS
- BEST-SELLING PRODUCTS
- MOST CONSUMED PRODUCT
- MOST TRADED PRODUCT
- MOST PROFITABLE PRODUCT FOR EXPORT
-
5. MOST PROMISING SUPPLYING COUNTRIES
Choosing the Best Countries to Establish Your Sustainable Supply Chain
This Chapter is Available Only for the Professional Edition PRO- TOP COUNTRIES TO SOURCE YOUR PRODUCT
- TOP PRODUCING COUNTRIES
- TOP EXPORTING COUNTRIES
- LOW-COST EXPORTING COUNTRIES
-
6. MOST PROMISING OVERSEAS MARKETS
Choosing the Best Countries to Boost Your Exports
This Chapter is Available Only for the Professional Edition PRO- TOP OVERSEAS MARKETS FOR EXPORTING YOUR PRODUCT
- TOP CONSUMING MARKETS
- UNSATURATED MARKETS
- TOP IMPORTING MARKETS
- MOST PROFITABLE MARKETS
7. PRODUCTION
The Latest Trends and Insights into The Industry
- PRODUCTION VOLUME AND VALUE
8. IMPORTS
The Largest Import Supplying Countries
- IMPORTS FROM 2012–2023
- IMPORTS BY COUNTRY
- IMPORT PRICES BY COUNTRY
9. EXPORTS
The Largest Destinations for Exports
- EXPORTS FROM 2012–2023
- EXPORTS BY COUNTRY
- EXPORT PRICES BY COUNTRY
-
10. PROFILES OF MAJOR PRODUCERS
The Largest Producers on The Market and Their Profiles
This Chapter is Available Only for the Professional Edition PRO -
LIST OF TABLES
- Key Findings In 2023
- Market Volume, In Physical Terms, 2012–2023
- Market Value, 2012–2023
- Per Capita Consumption In 2012-2023
- Imports, In Physical Terms, By Country, 2012–2023
- Imports, In Value Terms, By Country, 2012–2023
- Import Prices, By Country Of Origin, 2012–2023
- Exports, In Physical Terms, By Country, 2012–2023
- Exports, In Value Terms, By Country, 2012–2023
- Export Prices, By Country Of Destination, 2012–2023
-
LIST OF FIGURES
- Market Volume, In Physical Terms, 2012–2023
- Market Value, 2012–2023
- Market Structure – Domestic Supply vs. Imports, In Physical Terms, 2012-2023
- Market Structure – Domestic Supply vs. Imports, In Value Terms, 2012-2023
- Trade Balance, In Physical Terms, 2012-2023
- Trade Balance, In Value Terms, 2012-2023
- Per Capita Consumption, 2012-2023
- Market Volume Forecast to 2030
- Market Value Forecast to 2030
- Products: Market Size And Growth, By Type
- Products: Average Per Capita Consumption, By Type
- Products: Exports And Growth, By Type
- Products: Export Prices And Growth, By Type
- Production Volume And Growth
- Exports And Growth
- Export Prices And Growth
- Market Size And Growth
- Per Capita Consumption
- Imports And Growth
- Import Prices
- Production, In Physical Terms, 2012–2023
- Production, In Value Terms, 2012–2023
- Imports, In Physical Terms, 2012–2023
- Imports, In Value Terms, 2012–2023
- Imports, In Physical Terms, By Country, 2023
- Imports, In Physical Terms, By Country, 2012–2023
- Imports, In Value Terms, By Country, 2012–2023
- Import Prices, By Country Of Origin, 2012–2023
- Exports, In Physical Terms, 2012–2023
- Exports, In Value Terms, 2012–2023
- Exports, In Physical Terms, By Country, 2023
- Exports, In Physical Terms, By Country, 2012–2023
- Exports, In Value Terms, By Country, 2012–2023
- Export Prices, By Country Of Destination, 2012–2023


