
United Kingdom - Fiber Board Of Wood Or Other Ligneous Materials - Market Analysis, Forecast, Size, Trends and Insights
Get instant access to more than 2 million reports, dashboards, and datasets on the IndexBox Platform.
View PricingAugust 2023 Sees UK Fiberboard Imports Dip Slightly to $50M
United Kingdom Fiberboard Imports
In August 2023, overseas purchases of fiber board of wood or other ligneous materials decreased by -1.3% to 322K cubic meters, falling for the second month in a row after two months of growth. Overall, imports recorded a relatively flat trend pattern. The most prominent rate of growth was recorded in February 2023 with an increase of 27% against the previous month. Imports peaked at 380K cubic meters in June 2023; however, from July 2023 to August 2023, imports remained at a lower figure.
In value terms, fiberboard imports contracted modestly to $50M (IndexBox estimates) in August 2023. Over the period under review, imports recorded a relatively flat trend pattern. The growth pace was the most rapid in May 2023 with an increase of 23% month-to-month. Imports peaked at 59M cubic meters in June 2023; however, from July 2023 to August 2023, imports stood at a somewhat lower figure.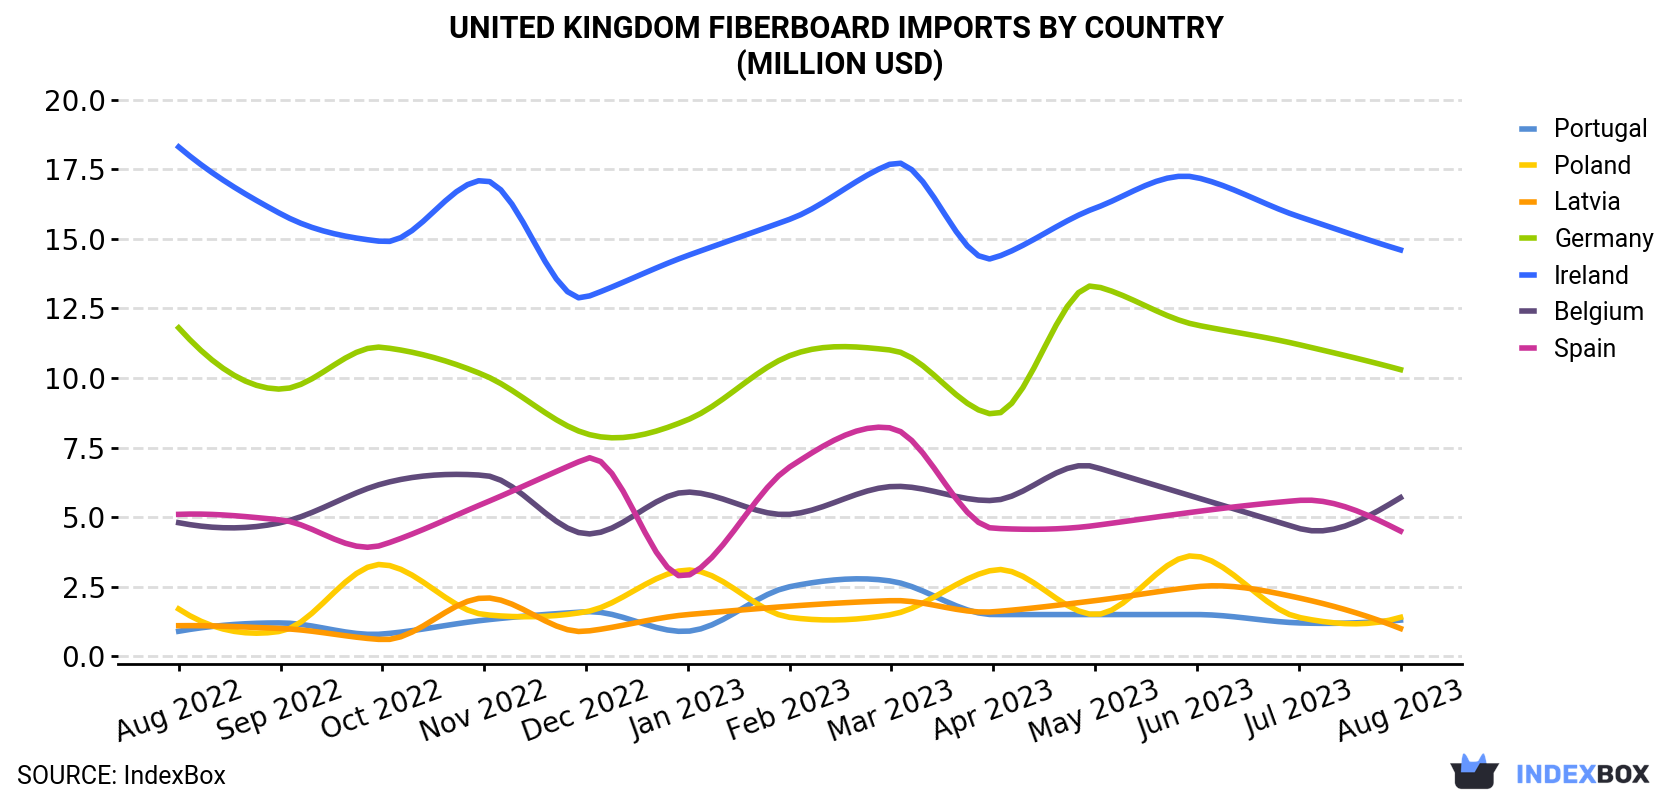
| COUNTRY | Import Value of Fiberboard in United Kingdom (million USD) | ||||||||||||
|---|---|---|---|---|---|---|---|---|---|---|---|---|---|
| Aug 2022 | Sep 2022 | Oct 2022 | Nov 2022 | Dec 2022 | Jan 2023 | Feb 2023 | Mar 2023 | Apr 2023 | May 2023 | Jun 2023 | Jul 2023 | Aug 2023 | |
| Ireland | 18.3 | 15.9 | 14.9 | 17.1 | 12.9 | 14.4 | 15.7 | 17.7 | 14.3 | 16.1 | 17.2 | 15.8 | 14.6 |
| Germany | 11.8 | 9.6 | 11.1 | 10.1 | 8.0 | 8.5 | 10.8 | 11.0 | 8.7 | 13.3 | 11.9 | 11.2 | 10.3 |
| Belgium | 4.8 | 4.8 | 6.2 | 6.5 | 4.4 | 5.9 | 5.1 | 6.1 | 5.6 | 6.8 | 5.7 | 4.6 | 5.7 |
| Spain | 5.1 | 4.9 | 4.0 | 5.5 | 7.1 | 2.9 | 6.8 | 8.2 | 4.6 | 4.7 | 5.2 | 5.6 | 4.5 |
| Poland | 1.7 | 0.9 | 3.3 | 1.5 | 1.6 | 3.1 | 1.4 | 1.5 | 3.1 | 1.5 | 3.6 | 1.4 | 1.4 |
| Portugal | 0.9 | 1.2 | 0.8 | 1.3 | 1.6 | 0.9 | 2.5 | 2.7 | 1.5 | 1.5 | 1.5 | 1.2 | 1.3 |
| Latvia | 1.1 | 1.0 | 0.6 | 2.1 | 0.9 | 1.5 | 1.8 | 2.0 | 1.6 | 2.0 | 2.5 | 2.1 | 1.0 |
| Others | 10.6 | 10.0 | 8.4 | 9.1 | 7.1 | 6.1 | 8.4 | 9.3 | 8.2 | 12.8 | 11.1 | 9.2 | 11.1 |
| Total | 54.3 | 48.2 | 49.4 | 53.1 | 43.5 | 43.3 | 52.5 | 58.5 | 47.7 | 58.6 | 58.8 | 51.0 | 50.0 |
Imports by Country
Ireland (95K cubic meters), Germany (58K cubic meters) and Belgium (29K cubic meters) were the main suppliers of fiberboard imports to the UK, with a combined 56% share of total imports. These countries were followed by Spain, Portugal, Poland and Latvia, which together accounted for a further 15%.
From August 2022 to August 2023, the biggest increases were in Portugal (with a CAGR of +5.2%), while purchases for the other leaders experienced more modest paces of growth.
In value terms, Ireland ($15M), Germany ($10M) and Belgium ($5.7M) were the largest fiberboard suppliers to the UK, together comprising 61% of total imports. These countries were followed by Spain, Poland, Portugal and Latvia, which together accounted for a further 16%.
Among the main suppliers, Portugal, with a CAGR of +3.1%, saw the highest rates of growth with regard to the value of imports, over the period under review, while purchases for the other leaders experienced mixed trend patterns.
Import Prices by Country
In August 2023, the fiberboard price amounted to $155 per cubic meter (CIF, United Kingdom), approximately reflecting the previous month. Overall, the import price recorded a relatively flat trend pattern. The pace of growth was the most pronounced in March 2023 an increase of 4.5% month-to-month. Over the period under review, average import prices hit record highs at $169 per cubic meter in December 2022; however, from January 2023 to August 2023, import prices remained at a lower figure.
There were significant differences in the average prices amongst the major supplying countries. In August 2023, the country with the highest price was Belgium ($199 per cubic meter), while the price for Brazil ($67.4 per cubic meter) was amongst the lowest.
From August 2022 to August 2023, the most notable rate of growth in terms of prices was attained by Latvia (+2.9%), while the prices for the other major suppliers experienced more modest paces of growth.
This report provides an in-depth analysis of the fiberboard market in the UK. Within it, you will discover the latest data on market trends and opportunities by country, consumption, production and price developments, as well as the global trade (imports and exports). The forecast exhibits the market prospects through 2030.
Product coverage:
- Prodcom 16211423 - Medium density fibreboard (MDF), of wood or other ligneous materials, whether or not bonded with resins or other organic substances, of a thickness not exceeding 5 mm
- Prodcom 16211426 - Medium density fibreboard (MDF), of wood or other ligneous materials, whether or not bonded with resins or other organic substances, of a thickness exceeding 5 mm but not exceeding 9 mm
- Prodcom 16211429 - Medium density fibreboard (MDF), of wood or other ligneous materials, whether or not bonded with resins or other organic substances, of a thickness exceeding 9 mm
- Prodcom 16211443 - Fibreboard (excluding medium density fibreboard [MDF]), of wood or other ligneous materials, whether or not bonded with resins or other organic substances, of a density exceeding 0,8 g/cm.
- Prodcom 16211446 - Fibreboard (excluding medium density fibreboard [MDF]), of wood or other ligneous materials, whether or not bonded with resins or other organic substances, of a density exceeding 0,5 g/cm. but not exceeding 0,8 g/cm.
- Prodcom 16211449 - Fibreboard of wood or other ligneous materials (excluding medium density fibreboard [MDF]), whether or not bonded with resins or other organic substances, of a density not exceeding 0,5 g/cm.
Country coverage:
- United Kingdom
Data coverage:
- Market volume and value
- Per Capita consumption
- Forecast of the market dynamics in the medium term
- Trade (exports and imports) in the UK
- Export and import prices
- Market trends, drivers and restraints
- Key market players and their profiles
Reasons to buy this report:
- Take advantage of the latest data
- Find deeper insights into current market developments
- Discover vital success factors affecting the market
This report is designed for manufacturers, distributors, importers, and wholesalers, as well as for investors, consultants and advisors.
In this report, you can find information that helps you to make informed decisions on the following issues:
- How to diversify your business and benefit from new market opportunities
- How to load your idle production capacity
- How to boost your sales on overseas markets
- How to increase your profit margins
- How to make your supply chain more sustainable
- How to reduce your production and supply chain costs
- How to outsource production to other countries
- How to prepare your business for global expansion
While doing this research, we combine the accumulated expertise of our analysts and the capabilities of artificial intelligence. The AI-based platform, developed by our data scientists, constitutes the key working tool for business analysts, empowering them to discover deep insights and ideas from the marketing data.
-
1. INTRODUCTION
Making Data-Driven Decisions to Grow Your Business
- REPORT DESCRIPTION
- RESEARCH METHODOLOGY AND AI PLATFORM
- DATA-DRIVEN DECISIONS FOR YOUR BUSINESS
- GLOSSARY AND SPECIFIC TERMS
-
2. EXECUTIVE SUMMARY
A Quick Overview of Market Performance
- KEY FINDINGS
- MARKET TRENDS This Chapter is Available Only for the Professional Edition PRO
-
3. MARKET OVERVIEW
Understanding the Current State of The Market and Its Prospects
- MARKET SIZE
- MARKET STRUCTURE
- TRADE BALANCE
- PER CAPITA CONSUMPTION
- MARKET FORECAST TO 2030
-
4. MOST PROMISING PRODUCT
Finding New Products to Diversify Your Business
This Chapter is Available Only for the Professional Edition PRO- TOP PRODUCTS TO DIVERSIFY YOUR BUSINESS
- BEST-SELLING PRODUCTS
- MOST CONSUMED PRODUCT
- MOST TRADED PRODUCT
- MOST PROFITABLE PRODUCT FOR EXPORT
-
5. MOST PROMISING SUPPLYING COUNTRIES
Choosing the Best Countries to Establish Your Sustainable Supply Chain
This Chapter is Available Only for the Professional Edition PRO- TOP COUNTRIES TO SOURCE YOUR PRODUCT
- TOP PRODUCING COUNTRIES
- TOP EXPORTING COUNTRIES
- LOW-COST EXPORTING COUNTRIES
-
6. MOST PROMISING OVERSEAS MARKETS
Choosing the Best Countries to Boost Your Exports
This Chapter is Available Only for the Professional Edition PRO- TOP OVERSEAS MARKETS FOR EXPORTING YOUR PRODUCT
- TOP CONSUMING MARKETS
- UNSATURATED MARKETS
- TOP IMPORTING MARKETS
- MOST PROFITABLE MARKETS
7. PRODUCTION
The Latest Trends and Insights into The Industry
- PRODUCTION VOLUME AND VALUE
8. IMPORTS
The Largest Import Supplying Countries
- IMPORTS FROM 2012–2023
- IMPORTS BY COUNTRY
- IMPORT PRICES BY COUNTRY
9. EXPORTS
The Largest Destinations for Exports
- EXPORTS FROM 2012–2023
- EXPORTS BY COUNTRY
- EXPORT PRICES BY COUNTRY
-
10. PROFILES OF MAJOR PRODUCERS
The Largest Producers on The Market and Their Profiles
This Chapter is Available Only for the Professional Edition PRO -
LIST OF TABLES
- Key Findings In 2023
- Market Volume, In Physical Terms, 2012–2023
- Market Value, 2012–2023
- Per Capita Consumption In 2012-2023
- Imports, In Physical Terms, By Country, 2012–2023
- Imports, In Value Terms, By Country, 2012–2023
- Import Prices, By Country Of Origin, 2012–2023
- Exports, In Physical Terms, By Country, 2012–2023
- Exports, In Value Terms, By Country, 2012–2023
- Export Prices, By Country Of Destination, 2012–2023
-
LIST OF FIGURES
- Market Volume, In Physical Terms, 2012–2023
- Market Value, 2012–2023
- Market Structure – Domestic Supply vs. Imports, In Physical Terms, 2012-2023
- Market Structure – Domestic Supply vs. Imports, In Value Terms, 2012-2023
- Trade Balance, In Physical Terms, 2012-2023
- Trade Balance, In Value Terms, 2012-2023
- Per Capita Consumption, 2012-2023
- Market Volume Forecast to 2030
- Market Value Forecast to 2030
- Products: Market Size And Growth, By Type
- Products: Average Per Capita Consumption, By Type
- Products: Exports And Growth, By Type
- Products: Export Prices And Growth, By Type
- Production Volume And Growth
- Exports And Growth
- Export Prices And Growth
- Market Size And Growth
- Per Capita Consumption
- Imports And Growth
- Import Prices
- Production, In Physical Terms, 2012–2023
- Production, In Value Terms, 2012–2023
- Imports, In Physical Terms, 2012–2023
- Imports, In Value Terms, 2012–2023
- Imports, In Physical Terms, By Country, 2023
- Imports, In Physical Terms, By Country, 2012–2023
- Imports, In Value Terms, By Country, 2012–2023
- Import Prices, By Country Of Origin, 2012–2023
- Exports, In Physical Terms, 2012–2023
- Exports, In Value Terms, 2012–2023
- Exports, In Physical Terms, By Country, 2023
- Exports, In Physical Terms, By Country, 2012–2023
- Exports, In Value Terms, By Country, 2012–2023
- Export Prices, By Country Of Destination, 2012–2023


