United Kingdom - Domestic Food Grinders And Mixers And Fruit Or Vegetable Juice Extractors - Market Analysis, Forecast, Size, Trends and Insights
Get instant access to more than 2 million reports, dashboards, and datasets on the IndexBox Platform.
View PricingImport of Food Mixers in UK Sees a Decrease to $153 Million in 2023
United Kingdom Food Mixer Imports
In 2023, the amount of domestic food grinders and mixers and fruit or vegetable juice extractors imported into the UK rose remarkably to 7.8M units, picking up by 9.7% on the year before. Over the period under review, imports, however, continue to indicate a mild decline. The most prominent rate of growth was recorded in 2020 when imports increased by 34% against the previous year. Over the period under review, imports attained the peak figure at 11M units in 2015; however, from 2016 to 2023, imports remained at a lower figure.
In value terms, food mixer imports shrank to $153M (IndexBox estimates) in 2023. In general, imports, however, showed a perceptible slump. The pace of growth appeared the most rapid in 2014 with an increase of 29%. Over the period under review, imports hit record highs at $290M in 2015; however, from 2016 to 2023, imports stood at a somewhat lower figure.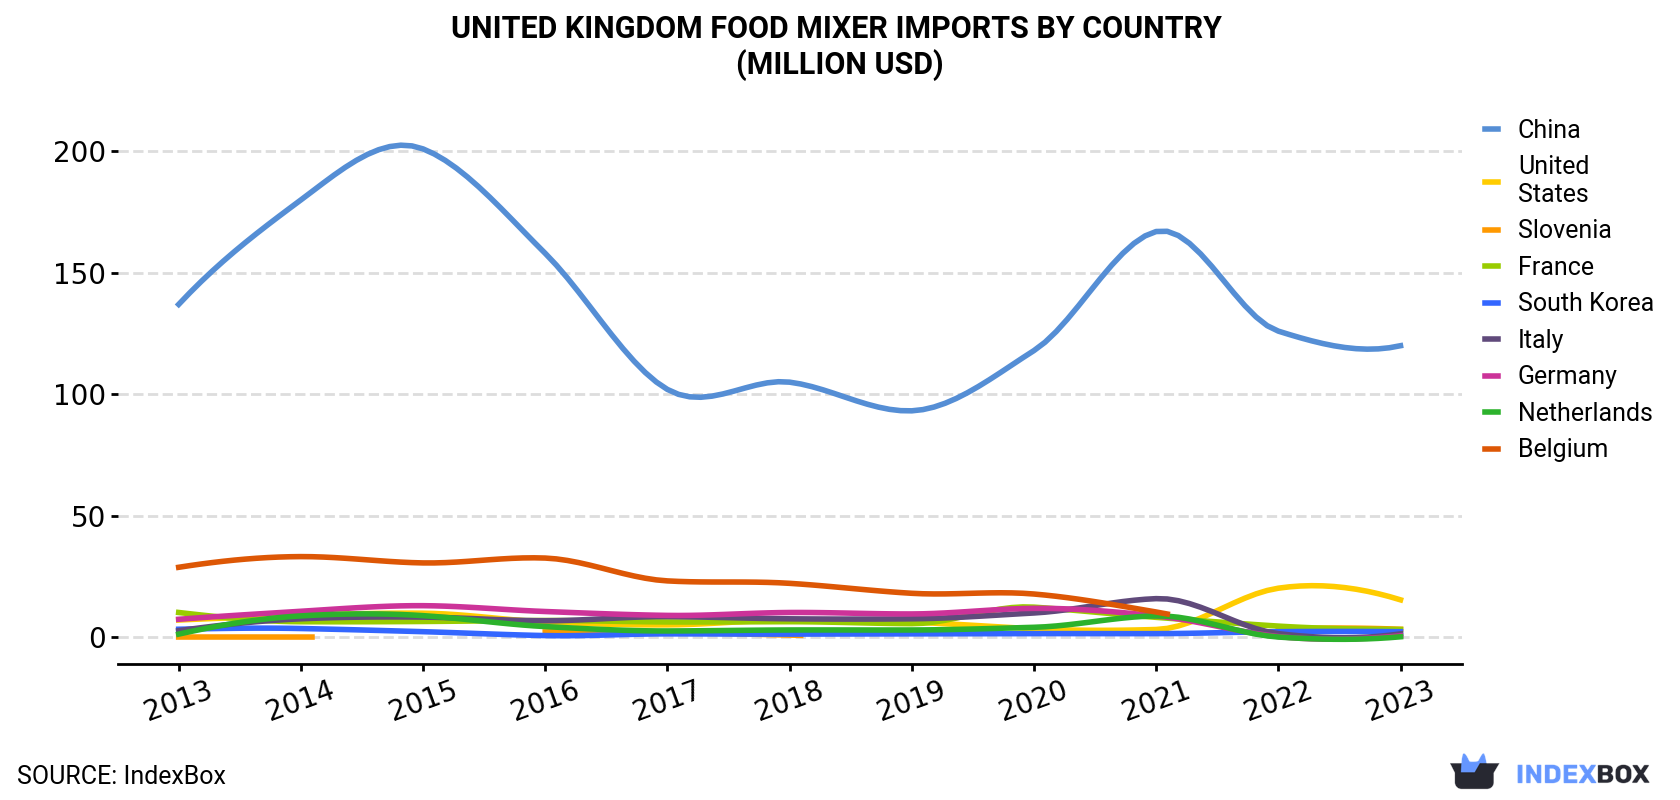
| COUNTRY | Import Value of Food Mixer in United Kingdom (million USD) | ||||||||||
|---|---|---|---|---|---|---|---|---|---|---|---|
| 2013 | 2014 | 2015 | 2016 | 2017 | 2018 | 2019 | 2020 | 2021 | 2022 | 2023 | |
| China | 137 | 180 | 201 | 158 | 102 | 105 | 93.2 | 118 | 167 | 126 | 120 |
| United States | 7.1 | 9.0 | 9.9 | 6.3 | 5.1 | 7.1 | 6.2 | 3.5 | 3.2 | 20.2 | 15.4 |
| Slovenia | 0.1 | 0.1 | N/A | 2.2 | 2.2 | 0.9 | N/A | N/A | N/A | 3.4 | 3.3 |
| France | 10.2 | 6.4 | 6.5 | 6.9 | 6.3 | 6.4 | 5.6 | 12.4 | 8.2 | 4.6 | 3.2 |
| South Korea | 3.3 | 3.6 | 2.3 | 0.7 | 1.4 | 1.3 | 1.4 | 1.5 | 1.5 | 2.3 | 2.3 |
| Italy | 2.7 | 7.6 | 8.3 | 6.8 | 8.5 | 7.6 | 7.6 | 10.0 | 15.9 | 1.5 | 1.4 |
| Germany | 7.4 | 10.7 | 13.0 | 10.6 | 9.0 | 10.2 | 9.6 | 11.9 | 8.8 | 0.3 | 0.6 |
| Netherlands | 1.3 | 8.8 | 8.9 | 4.4 | 2.6 | 3.0 | 3.0 | 4.1 | 8.8 | 0.1 | 0.2 |
| Belgium | 28.8 | 33.2 | 30.6 | 32.6 | 23.2 | 22.2 | 18.1 | 17.8 | 10.4 | N/A | N/A |
| Others | 8.8 | 7.2 | 9.2 | 5.7 | 4.1 | 5.9 | 4.8 | 6.6 | 7.7 | 8.4 | 6.2 |
| Total | 206 | 267 | 290 | 234 | 164 | 170 | 149 | 186 | 231 | 167 | 153 |
Imports by Country
In 2023, China (7.3M units) was the main supplier of food mixer to the UK, accounting for a 94% share of total imports. It was followed by Slovenia (76K units), with a 1% share of total imports. the United States (58K units) ranked third in terms of total imports with a 0.8% share.
From 2013 to 2023, the average annual growth rate of volume from China amounted to -1.1%. The remaining supplying countries recorded the following average annual rates of imports growth: Slovenia (+16.1% per year) and the United States (+4.0% per year).
In value terms, China ($120M) constituted the largest supplier of domestic food grinders and mixers and fruit or vegetable juice extractors to the UK, comprising 79% of total imports. The second position in the ranking was held by the United States ($15M), with a 10% share of total imports. It was followed by Slovenia, with a 2.2% share.
From 2013 to 2023, the average annual rate of growth in terms of value from China stood at -1.3%. The remaining supplying countries recorded the following average annual rates of imports growth: the United States (+8.1% per year) and Slovenia (+38.0% per year).
Import Prices by Country
In 2023, the food mixer price amounted to $20 per unit (CIF, United Kingdom), waning by -16.2% against the previous year. Over the period under review, the import price saw a slight reduction. The most prominent rate of growth was recorded in 2022 when the average import price increased by 15%. Over the period under review, average import prices reached the peak figure at $25 per unit in 2015; however, from 2016 to 2023, import prices remained at a lower figure.
There were significant differences in the average prices amongst the major supplying countries. In 2023, amid the top importers, the country with the highest price was Italy ($64 per unit), while the price for China ($16 per unit) was amongst the lowest.
From 2013 to 2023, the most notable rate of growth in terms of prices was attained by Germany (+7.0%), while the prices for the other major suppliers experienced a decline.
This report provides an in-depth analysis of the food mixer market in the UK. Within it, you will discover the latest data on market trends and opportunities by country, consumption, production and price developments, as well as the global trade (imports and exports). The forecast exhibits the market prospects through 2030.
Product coverage:
- Prodcom 27512170 - Domestic food grinders, mixers and fruit or vegetable juice extractors, with a self-contained electric motor
Country coverage:
- United Kingdom
Data coverage:
- Market volume and value
- Per Capita consumption
- Forecast of the market dynamics in the medium term
- Trade (exports and imports) in the UK
- Export and import prices
- Market trends, drivers and restraints
- Key market players and their profiles
Reasons to buy this report:
- Take advantage of the latest data
- Find deeper insights into current market developments
- Discover vital success factors affecting the market
This report is designed for manufacturers, distributors, importers, and wholesalers, as well as for investors, consultants and advisors.
In this report, you can find information that helps you to make informed decisions on the following issues:
- How to diversify your business and benefit from new market opportunities
- How to load your idle production capacity
- How to boost your sales on overseas markets
- How to increase your profit margins
- How to make your supply chain more sustainable
- How to reduce your production and supply chain costs
- How to outsource production to other countries
- How to prepare your business for global expansion
While doing this research, we combine the accumulated expertise of our analysts and the capabilities of artificial intelligence. The AI-based platform, developed by our data scientists, constitutes the key working tool for business analysts, empowering them to discover deep insights and ideas from the marketing data.
-
1. INTRODUCTION
Making Data-Driven Decisions to Grow Your Business
- REPORT DESCRIPTION
- RESEARCH METHODOLOGY AND AI PLATFORM
- DATA-DRIVEN DECISIONS FOR YOUR BUSINESS
- GLOSSARY AND SPECIFIC TERMS
-
2. EXECUTIVE SUMMARY
A Quick Overview of Market Performance
- KEY FINDINGS
- MARKET TRENDS This Chapter is Available Only for the Professional Edition PRO
-
3. MARKET OVERVIEW
Understanding the Current State of The Market and Its Prospects
- MARKET SIZE
- MARKET STRUCTURE
- TRADE BALANCE
- PER CAPITA CONSUMPTION
- MARKET FORECAST TO 2030
-
4. MOST PROMISING PRODUCT
Finding New Products to Diversify Your Business
This Chapter is Available Only for the Professional Edition PRO- TOP PRODUCTS TO DIVERSIFY YOUR BUSINESS
- BEST-SELLING PRODUCTS
- MOST CONSUMED PRODUCT
- MOST TRADED PRODUCT
- MOST PROFITABLE PRODUCT FOR EXPORT
-
5. MOST PROMISING SUPPLYING COUNTRIES
Choosing the Best Countries to Establish Your Sustainable Supply Chain
This Chapter is Available Only for the Professional Edition PRO- TOP COUNTRIES TO SOURCE YOUR PRODUCT
- TOP PRODUCING COUNTRIES
- TOP EXPORTING COUNTRIES
- LOW-COST EXPORTING COUNTRIES
-
6. MOST PROMISING OVERSEAS MARKETS
Choosing the Best Countries to Boost Your Exports
This Chapter is Available Only for the Professional Edition PRO- TOP OVERSEAS MARKETS FOR EXPORTING YOUR PRODUCT
- TOP CONSUMING MARKETS
- UNSATURATED MARKETS
- TOP IMPORTING MARKETS
- MOST PROFITABLE MARKETS
7. PRODUCTION
The Latest Trends and Insights into The Industry
- PRODUCTION VOLUME AND VALUE
8. IMPORTS
The Largest Import Supplying Countries
- IMPORTS FROM 2012–2023
- IMPORTS BY COUNTRY
- IMPORT PRICES BY COUNTRY
9. EXPORTS
The Largest Destinations for Exports
- EXPORTS FROM 2012–2023
- EXPORTS BY COUNTRY
- EXPORT PRICES BY COUNTRY
-
10. PROFILES OF MAJOR PRODUCERS
The Largest Producers on The Market and Their Profiles
This Chapter is Available Only for the Professional Edition PRO -
LIST OF TABLES
- Key Findings In 2023
- Market Volume, In Physical Terms, 2012–2023
- Market Value, 2012–2023
- Per Capita Consumption In 2012-2023
- Imports, In Physical Terms, By Country, 2012–2023
- Imports, In Value Terms, By Country, 2012–2023
- Import Prices, By Country Of Origin, 2012–2023
- Exports, In Physical Terms, By Country, 2012–2023
- Exports, In Value Terms, By Country, 2012–2023
- Export Prices, By Country Of Destination, 2012–2023
-
LIST OF FIGURES
- Market Volume, In Physical Terms, 2012–2023
- Market Value, 2012–2023
- Market Structure – Domestic Supply vs. Imports, In Physical Terms, 2012-2023
- Market Structure – Domestic Supply vs. Imports, In Value Terms, 2012-2023
- Trade Balance, In Physical Terms, 2012-2023
- Trade Balance, In Value Terms, 2012-2023
- Per Capita Consumption, 2012-2023
- Market Volume Forecast to 2030
- Market Value Forecast to 2030
- Products: Market Size And Growth, By Type
- Products: Average Per Capita Consumption, By Type
- Products: Exports And Growth, By Type
- Products: Export Prices And Growth, By Type
- Production Volume And Growth
- Exports And Growth
- Export Prices And Growth
- Market Size And Growth
- Per Capita Consumption
- Imports And Growth
- Import Prices
- Production, In Physical Terms, 2012–2023
- Production, In Value Terms, 2012–2023
- Imports, In Physical Terms, 2012–2023
- Imports, In Value Terms, 2012–2023
- Imports, In Physical Terms, By Country, 2023
- Imports, In Physical Terms, By Country, 2012–2023
- Imports, In Value Terms, By Country, 2012–2023
- Import Prices, By Country Of Origin, 2012–2023
- Exports, In Physical Terms, 2012–2023
- Exports, In Value Terms, 2012–2023
- Exports, In Physical Terms, By Country, 2023
- Exports, In Physical Terms, By Country, 2012–2023
- Exports, In Value Terms, By Country, 2012–2023
- Export Prices, By Country Of Destination, 2012–2023


