World - Spices - Market Analysis, Forecast, Size, Trends and Insights
Get instant access to more than 2 million reports, dashboards, and datasets on the IndexBox Platform.
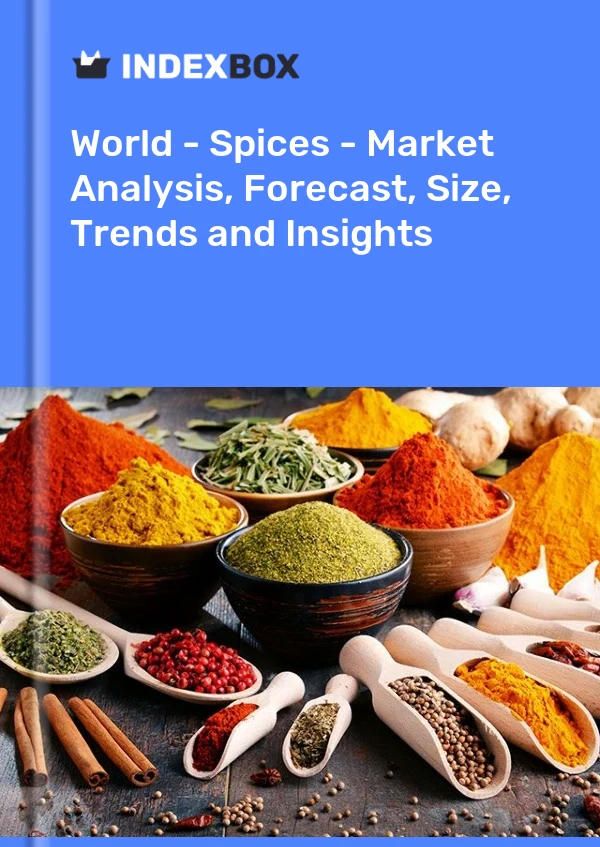
View PricingCooking Spices
Spices are an essential part of the culinary world, adding flavor, aroma, and color to dishes. They are derived from various plant parts such as bark, seeds, fruits, roots, and even flowers. Each spice has its unique profile and characteristics, making them invaluable in creating diverse and delicious cuisines.
Common Culinary Spices:
1. Cinnamon: Derived from the bark of Cinnamomum trees, cinnamon is a popular spice used in both sweet and savory dishes. It has a warm and sweet flavor and is often used in baking, curries, and mulled beverages.
2. Turmeric: Known for its vibrant yellow color, turmeric is a staple spice in Indian and Middle Eastern cuisines. It has a slightly bitter flavor with earthy undertones and is commonly used in curries and rice dishes.
3. Cumin: Cumin seeds are commonly used in Indian, Mexican, and Middle Eastern cooking. They have a warm and earthy flavor, complementing dishes like chili, stews, and spice blends.
4. Paprika: Made from grinding dried red bell peppers or chili peppers, paprika adds a mild flavor and vibrant red color to dishes. It is commonly used in Hungarian and Spanish cuisines, imparting a smoky and slightly sweet taste.
5. Black Pepper: One of the most widely used spices, black pepper adds pungency and heat to dishes. It is used in both whole and ground form and pairs well with almost all savory dishes.
Exotic and Aromatic Spices:
1. Saffron: Derived from the Crocus flower, saffron is the world's most expensive spice. It has a distinct floral flavor and imparts a golden-yellow color to dishes. Saffron is commonly used in Persian and Mediterranean cuisines.
2. Cardamom: With its fragrant and citrusy flavor, cardamom is used in both sweet and savory dishes. It is a popular spice in Indian and Scandinavian cuisines, adding depth to curries, desserts, and baked goods.
3. Star Anise: Star anise has a licorice-like flavor and is often used in Chinese and Vietnamese cuisines. It adds a unique aroma to soups, braised meats, and spice blends.
4. Cloves: Cloves have a warm and slightly sweet flavor and are commonly used in baking, pickling, and spice blends. They are a key component in traditional spice mixes like garam masala and pumpkin spice.
5. Fenugreek: Fenugreek seeds have a bitter flavor and are commonly used in Indian and Middle Eastern cuisines. They add a unique taste to curries, chutneys, and pickles.
Health Benefits:
In addition to their flavor-enhancing properties, many spices also offer various health benefits. For example, turmeric has anti-inflammatory properties, cinnamon may help regulate blood sugar levels, and ginger can aid in digestion. These spices are often used in traditional medicine and herbal remedies.
It's important to store spices correctly to maintain their flavor and potency. They should be kept in airtight containers away from heat, moisture, and direct sunlight. Whole spices generally have a longer shelf life compared to ground spices, as their flavor compounds remain intact until they are crushed or ground.
Spices add depth, complexity, and excitement to dishes, turning an ordinary meal into an extraordinary culinary experience. Their versatility allows chefs and home cooks to experiment and create an array of flavors, making spice usage a crucial skill in the art of cooking.
This report provides an in-depth analysis of the global spice market. Within it, you will discover the latest data on market trends and opportunities by country, consumption, production and price developments, as well as the global trade (imports and exports). The forecast exhibits the market prospects through 2030.
Product coverage:
- FCL 687 - Pepper
- FCL 689 - Pimento
- FCL 692 - Vanilla
- FCL 693 - Cinnamon (canella)
- FCL 698 - Cloves
- FCL 702 - Nutmeg, mace, cardamoms
- FCL 711 - Anise, badian, fennel
- FCL 720 - Ginger
- FCL 723 - Spices nes
Country coverage:
Worldwide - the report contains statistical data for 200 countries and includes detailed profiles of the 50 largest consuming countries:
- USA
- China
- Japan
- Germany
- United Kingdom
- France
- Brazil
- Italy
- Russian Federation
- India
- Canada
- Australia
- Republic of Korea
- Spain
- Mexico
- Indonesia
- Netherlands
- Turkey
- Saudi Arabia
- Switzerland
- Sweden
- Nigeria
- Poland
- Belgium
- Argentina
- Norway
- Austria
- Thailand
- United Arab Emirates
- Colombia
- Denmark
- South Africa
- Malaysia
- Israel
- Singapore
- Egypt
- Philippines
- Finland
- Chile
- Ireland
- Pakistan
- Greece
- Portugal
- Kazakhstan
- Algeria
- Czech Republic
- Qatar
- Peru
- Romania
- Vietnam
+ the largest producing countries
Data coverage:
- Global market volume and value
- Per Capita consumption
- Forecast of the market dynamics in the medium term
- Global production, split by region and country
- Global trade (exports and imports)
- Export and import prices
- Market trends, drivers and restraints
- Key market players and their profiles
Company coverage:
Reasons to buy this report:
- Take advantage of the latest data
- Find deeper insights into current market developments
- Discover vital success factors affecting the market
This report is designed for manufacturers, distributors, importers, and wholesalers, as well as for investors, consultants and advisors.
In this report, you can find information that helps you to make informed decisions on the following issues:
- How to diversify your business and benefit from new market opportunities
- How to load your idle production capacity
- How to boost your sales on overseas markets
- How to increase your profit margins
- How to make your supply chain more sustainable
- How to reduce your production and supply chain costs
- How to outsource production to other countries
- How to prepare your business for global expansion
While doing this research, we combine the accumulated expertise of our analysts and the capabilities of artificial intelligence. The AI-based platform, developed by our data scientists, constitutes the key working tool for business analysts, empowering them to discover deep insights and ideas from the marketing data.
-
1. INTRODUCTION
Making Data-Driven Decisions to Grow Your Business
- REPORT DESCRIPTION
- RESEARCH METHODOLOGY AND AI PLATFORM
- DATA-DRIVEN DECISIONS FOR YOUR BUSINESS
- GLOSSARY AND SPECIFIC TERMS
-
2. EXECUTIVE SUMMARY
A Quick Overview of Market Performance
- KEY FINDINGS
- MARKET TRENDS This Chapter is Available Only for the Professional Edition PRO
-
3. MARKET OVERVIEW
Understanding the Current State of The Market and Its Prospects
- MARKET SIZE
- CONSUMPTION BY COUNTRY
- MARKET FORECAST TO 2030
-
4. MOST PROMISING PRODUCT
Finding New Products to Diversify Your Business
This Chapter is Available Only for the Professional Edition PRO- TOP PRODUCTS TO DIVERSIFY YOUR BUSINESS
- BEST-SELLING PRODUCTS
- MOST CONSUMED PRODUCT
- MOST TRADED PRODUCT
- MOST PROFITABLE PRODUCT FOR EXPORT
-
5. MOST PROMISING SUPPLYING COUNTRIES
Choosing the Best Countries to Establish Your Sustainable Supply Chain
This Chapter is Available Only for the Professional Edition PRO- TOP COUNTRIES TO SOURCE YOUR PRODUCT
- TOP PRODUCING COUNTRIES
- COUNTRIES WITH TOP YIELDS
- TOP EXPORTING COUNTRIES
- LOW-COST EXPORTING COUNTRIES
-
6. MOST PROMISING OVERSEAS MARKETS
Choosing the Best Countries to Boost Your Exports
This Chapter is Available Only for the Professional Edition PRO- TOP OVERSEAS MARKETS FOR EXPORTING YOUR PRODUCT
- TOP CONSUMING MARKETS
- UNSATURATED MARKETS
- TOP IMPORTING MARKETS
- MOST PROFITABLE MARKETS
7. GLOBAL PRODUCTION
The Latest Trends and Insights into The Industry
- PRODUCTION VOLUME AND VALUE
- PRODUCTION BY COUNTRY
- HARVESTED AREA AND YIELD BY COUNTRY
8. GLOBAL IMPORTS
The Largest Importers on The Market and How They Succeed
- IMPORTS FROM 2012–2023
- IMPORTS BY COUNTRY
- IMPORT PRICES BY COUNTRY
9. GLOBAL EXPORTS
The Largest Exporters on The Market and How They Succeed
- EXPORTS FROM 2012–2023
- EXPORTS BY COUNTRY
- EXPORT PRICES BY COUNTRY
-
10. PROFILES OF MAJOR PRODUCERS
The Largest Producers on The Market and Their Profiles
This Chapter is Available Only for the Professional Edition PRO -
11. COUNTRY PROFILES
The Largest Markets And Their Profiles
This Chapter is Available Only for the Professional Edition PRO- United States
- China
- Japan
- Germany
- United Kingdom
- France
- Brazil
- Italy
- Russian Federation
- India
- Canada
- Australia
- Republic of Korea
- Spain
- Mexico
- Indonesia
- Netherlands
- Turkey
- Saudi Arabia
- Switzerland
- Sweden
- Nigeria
- Poland
- Belgium
- Argentina
- Norway
- Austria
- Thailand
- United Arab Emirates
- Colombia
- Denmark
- South Africa
- Malaysia
- Israel
- Singapore
- Egypt
- Philippines
- Finland
- Chile
- Ireland
- Pakistan
- Greece
- Portugal
- Kazakhstan
- Algeria
- Czech Republic
- Qatar
- Peru
- Romania
- Vietnam
-
LIST OF TABLES
- Key Findings In 2023
- Market Volume, In Physical Terms, 2012–2023
- Market Value, 2012–2023
- Per Capita Consumption, By Country, 2018–2023
- Production, In Physical Terms, By Country, 2012–2023
- Harvested Area, By Country, 2012-2023
- Yield, By Country, 2012-2023
- Imports, In Physical Terms, By Country, 2012–2023
- Imports, In Value Terms, By Country, 2012–2023
- Import Prices, By Country Of Destination, 2012–2023
- Exports, In Physical Terms, By Country, 2012–2023
- Exports, In Value Terms, By Country, 2012–2023
- Export Prices, By Country Of Origin, 2012–2023
-
LIST OF FIGURES
- Market Volume, In Physical Terms, 2012–2023
- Market Value, 2012–2023
- Consumption, By Country, 2023
- Market Volume Forecast to 2030
- Market Value Forecast to 2030
- Products: Market Size And Growth, By Type
- Products: Average Per Capita Consumption, By Type
- Products: Exports And Growth, By Type
- Products: Export Prices And Growth, By Type
- Production Volume And Growth
- Yield And Growth
- Exports And Growth
- Export Prices And Growth
- Market Size And Growth
- Per Capita Consumption
- Imports And Growth
- Import Prices
- Production, In Physical Terms, 2012–2023
- Production, In Value Terms, 2012–2023
- Area Harvested, 2012–2023
- Yield, 2012–2023
- Production, By Country, 2023
- Production, In Physical Terms, By Country, 2012–2023
- Harvested Area, By Country, 2023
- Harvested Area, By Country, 2012-2023
- Yield, By Country, 2012-2023
- Imports, In Physical Terms, 2012–2023
- Imports, In Value Terms, 2012–2023
- Imports, In Physical Terms, By Country, 2023
- Imports, In Physical Terms, By Country, 2012–2023
- Imports, In Value Terms, By Country, 2012–2023
- Import Prices, By Country, 2012–2023
- Exports, In Physical Terms, 2012–2023
- Exports, In Value Terms, 2012–2023
- Exports, In Physical Terms, By Country, 2023
- Exports, In Physical Terms, By Country, 2012–2023
- Exports, In Value Terms, By Country, 2012–2023
- Export Prices, 2012–2023
This report provides an in-depth analysis of the global spice market.
This report provides an in-depth analysis of the global piper pepper market.
This report provides an in-depth analysis of the global pimenta pepper market.
Explore the top import markets for spice worldwide, including the United States, India, China, Germany, and the United Arab Emirates. Discover key statistics and market insights from the IndexBox market intelligence platform.
The global spice market is forecast to reach a value of $54.1 billion by 2030, growing at a CAGR of around 4.1% during 2022-2030.
The global spice market is expected to grow at a CAGR of over 3.5% from 2022 to 2025.
Among leading importers, China, India, and the U.S. saw the highest growth rates of imports over the past decade.
The lockdown caused a surge in household demand, and the costs of some spices were going through the roof during the pandemic.
The global spice market amounted to $33.1B in 2019, leveling off at the previous year. This figure reflects the total...
Driven by increasing demand for pepper worldwide, the market is expected to continue an upward consumption trend over the next seven-year period.
Global pepper consumption amounted to X thousand tons in 2015, going down by -X% against the previous year level.
Global pepper imports amounted to X thousand tons in 2015, picking up by +X% against the previous year level.
The global pepper market showed steady growth, rising from X thousand tons in 2007 to X thousand tons in 2015.


